Neiman Marcus 2006 Annual Report Download - page 29
Download and view the complete annual report
Please find page 29 of the 2006 Neiman Marcus annual report below. You can navigate through the pages in the report by either clicking on the pages listed below, or by using the keyword search tool below to find specific information within the annual report.-
 1
1 -
2
-
3
-
4
-
5
-
6
-
7
-
8
-
9
-
10
-
11
-
12
-
13
-
14
-
15
-
16
-
17
-
18
-
 19
19 -
 20
20 -
 21
21 -
 22
22 -
 23
23 -
 24
24 -
 25
25 -
 26
26 -
 27
27 -
 28
28 -
 29
29 -
 30
30 -
 31
31 -
 32
32 -
 33
33 -
 34
34 -
 35
35 -
 36
36 -
 37
37 -
 38
38 -
 39
39 -
40
-
41
-
42
-
43
-
44
-
45
-
46
-
47
-
48
-
49
-
50
-
51
-
52
-
53
-
54
-
55
-
56
-
57
-
58
-
59
-
60
-
61
-
62
-
63
-
64
-
65
-
66
-
67
-
68
-
69
-
70
-
71
-
72
-
73
-
74
-
75
-
76
-
77
-
78
-
79
-
80
-
81
-
82
-
83
-
84
-
85
-
86
-
87
-
88
-
89
-
90
-
91
-
92
-
93
-
94
-
95
-
96
-
97
-
98
-
99
-
100
-
101
-
102
-
103
-
104
-
105
-
106
-
107
-
108
-
109
-
110
-
111
-
112
-
113
-
114
-
115
-
116
-
117
-
118
-
119
-
120
-
121
-
122
-
123
-
124
-
125
-
126
-
127
-
128
-
129
-
130
-
131
-
132
-
133
-
134
-
135
-
136
-
137
-
138
-
139
-
140
-
141
-
142
-
143
-
144
-
145
-
146
-
147
-
148
-
149
-
150
-
151
-
152
-
153
-
154
-
155
-
156
-
157
-
158
-
159
-
160
-
161
-
162
-
163
-
164
-
165
-
166
-
167
-
168
-
169
-
170
-
171
 |
 |

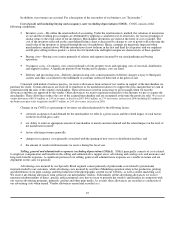
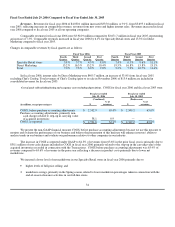
reduction to selling, general and administrative expenses aggregated approximately $63.4 million, or 1.4% of revenues, in fiscal year
2007, $61.7 million, or 1.5% of revenues, in fiscal year 2006 (including $18.6 million for the Predecessor prior to the Acquisition) and
$57.5 million, or 1.6% of revenues, in fiscal year 2005.
We also receive allowances from certain merchandise vendors in conjunction with compensation programs for employees who
sell the vendor's merchandise. These allowances are netted against the related compensation expense that we incur. Amounts received
from vendors related to compensation programs were $65.4 million, or 1.5% of revenues, in fiscal year 2007, $59.5 million, or 1.5% of
revenues, in fiscal year 2006 (including $10.1 million for the Predecessor prior to the Acquisition) and $53.2 million, or 1.4% of
revenues, in fiscal year 2005.
Changes in our selling, general and administrative expenses are affected primarily by the following factors:
• changes in the number of sales associates primarily due to new store openings and expansion of existing stores, including
increased health care and related benefits expenses;
• changes in expenses incurred in connection with our advertising and marketing programs; and
• changes in expenses related to insurance and long-term benefits due to general economic conditions such as rising health
care costs.
Income from credit card program. Prior to the Credit Card Sale on July 7, 2005, our credit card operations generated finance
charge income, net of credit losses, which we recognized as income when earned. As a part of the Credit Card Sale, we entered into a
long-term marketing and servicing alliance with HSBC that expires in June 2010. Under the terms of this alliance, HSBC offers credit
card and non-card payment plans and bears all credit risk with respect to sales transacted on the cards bearing our brands. We receive
ongoing payments from HSBC based on net credit card sales and compensation for marketing and servicing activities (HSBC Program
Income). We recognize HSBC Program Income when earned.
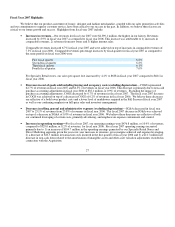
As a percentage of revenues, the HSBC Program Income is lower than the net finance charge income we earned prior to the
Credit Card Sale. However, the resulting decrease in income from credit card program is mitigated, in part, by 1) decreases in SG&A
expenses we incur due to the transfer of certain servicing functions to HSBC after the sale, 2) decreases in our capital investments related
to the servicing of the credit card portfolio and 3) decreases in carrying costs related to our previous funding of the seasonal working
capital requirements of the credit card portfolio. In tandem with HSBC, we initiated various changes in our credit card program to alter
the credit terms available to our cardholders and to enhance the earnings of the portfolio. In the future, the HSBC Program Income may
be:
• increased or decreased based upon future changes to our historical credit card program related to, among other things, the
interest rates applied to unpaid balances and the assessment of late fees; and
• decreased based upon the level of future services we provide to HSBC.
26