Neiman Marcus 2006 Annual Report Download - page 33
Download and view the complete annual report
Please find page 33 of the 2006 Neiman Marcus annual report below. You can navigate through the pages in the report by either clicking on the pages listed below, or by using the keyword search tool below to find specific information within the annual report.-
 1
1 -
2
-
3
-
4
-
5
-
6
-
7
-
8
-
9
-
10
-
11
-
12
-
13
-
14
-
15
-
16
-
17
-
18
-
19
-
20
-
21
-
22
-
 23
23 -
 24
24 -
 25
25 -
 26
26 -
 27
27 -
 28
28 -
 29
29 -
 30
30 -
 31
31 -
 32
32 -
 33
33 -
 34
34 -
 35
35 -
 36
36 -
 37
37 -
 38
38 -
 39
39 -
 40
40 -
 41
41 -
 42
42 -
 43
43 -
44
-
45
-
46
-
47
-
48
-
49
-
50
-
51
-
52
-
53
-
54
-
55
-
56
-
57
-
58
-
59
-
60
-
61
-
62
-
63
-
64
-
65
-
66
-
67
-
68
-
69
-
70
-
71
-
72
-
73
-
74
-
75
-
76
-
77
-
78
-
79
-
80
-
81
-
82
-
83
-
84
-
85
-
86
-
87
-
88
-
89
-
90
-
91
-
92
-
93
-
94
-
95
-
96
-
97
-
98
-
99
-
100
-
101
-
102
-
103
-
104
-
105
-
106
-
107
-
108
-
109
-
110
-
111
-
112
-
113
-
114
-
115
-
116
-
117
-
118
-
119
-
120
-
121
-
122
-
123
-
124
-
125
-
126
-
127
-
128
-
129
-
130
-
131
-
132
-
133
-
134
-
135
-
136
-
137
-
138
-
139
-
140
-
141
-
142
-
143
-
144
-
145
-
146
-
147
-
148
-
149
-
150
-
151
-
152
-
153
-
154
-
155
-
156
-
157
-
158
-
159
-
160
-
161
-
162
-
163
-
164
-
165
-
166
-
167
-
168
-
169
-
170
-
171
 |
 |
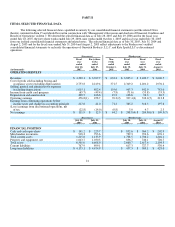
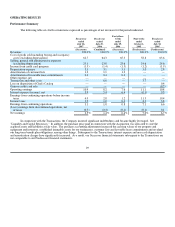
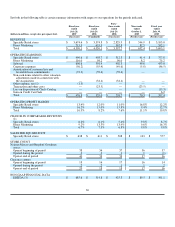
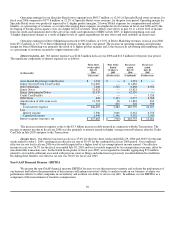
Set forth in the following table is certain summary information with respect to our operations for the periods indicated.
(dollars in millions, except sales per square foot)
Fiscal year
ended
July 28,
2007
Fiscal year
ended
July 29,
2006
Forty-
three weeks
ended
July 29,
2006
Nine weeks
ended
October 1,
2005
Fiscal year
ended
July 30,
2005
(Successor) (Combined) (Successor) (Predecessor) (Predecessor)
REVENUES
Specialty Retail stores $ 3,674.6 $ 3,374.8 $ 2,829.9 $ 544.9 $ 3,103.0
Direct Marketing 715.5 655.3 567.8 87.5 592.1
Total $ 4,390.1 $ 4,030.1 $ 3,397.7 $ 632.4 $ 3,695.1
OPERATING EARNINGS
Specialty Retail stores $ 490.6 $ 403.7 $ 312.3 $ 91.4 $ 377.8
Direct Marketing 116.0 98.2 90.0 8.2 75.2
Subtotal 606.6 501.9 402.3 99.6 453.0
Corporate expenses (56.2) (55.4) (49.6) (5.8) (46.5)
Amortization of customer lists and
favorable lease commitments (72.3) (59.6) (59.6) — —
Non-cash items related to other valuation
adjustments made in connection with
the Acquisition — (34.4) (34.4) — —
Other expense, net (1) (1.3) — — — —
Transaction and other costs — (23.5) — (23.5) —
Loss on disposition of Chef's Catalog — — — — (15.3)
Gain on Credit Card Sale — — — — 6.2
Total $ 476.8 $ 329.0 $ 258.7 $ 70.3 $ 397.4
OPERATING PROFIT MARGIN
Specialty Retail stores 13.4% 12.0% 11.0% 16.8% 12.2%
Direct Marketing 16.2% 15.0% 15.8% 9.4% 12.7%
Total 10.9% 8.2% 7.6% 11.1% 10.8%
CHANGE IN COMPARABLE REVENUES
(2)
Specialty Retail stores 6.2% 6.1% 5.4% 9.8% 8.7%
Direct Marketing 9.2% 13.3% 13.9% 9.6% 16.3%
Total 6.7% 7.3% 6.8% 9.8% 9.8%
SALES PER SQUARE FOOT
Specialty Retail stores $ 638 $ 611 $ 508 $ 103 $ 577
STORE COUNT
Neiman Marcus and Bergdorf Goodman
stores:
Open at beginning of period 38 36 37 36 37
Opened during the period 2 2 1 1 (1)
Open at end of period 40 38 38 37 36
Clearance centers:
Open at beginning of period 18 16 17 16 14
Opened during the period 2 2 1 1 2
Open at end of period 20 18 18 17 16
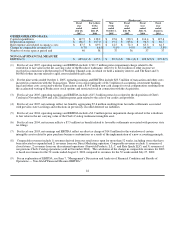
NON-GAAP FINANCIAL DATA
EBITDA (3) $ 685.6 $ 514.8 $ 425.3 $ 89.5 $ 501.1
30