Neiman Marcus 2006 Annual Report Download - page 30
Download and view the complete annual report
Please find page 30 of the 2006 Neiman Marcus annual report below. You can navigate through the pages in the report by either clicking on the pages listed below, or by using the keyword search tool below to find specific information within the annual report.-
 1
1 -
2
-
3
-
4
-
5
-
6
-
7
-
8
-
9
-
10
-
11
-
12
-
13
-
14
-
15
-
16
-
17
-
18
-
19
-
 20
20 -
 21
21 -
 22
22 -
 23
23 -
 24
24 -
 25
25 -
 26
26 -
 27
27 -
 28
28 -
 29
29 -
 30
30 -
 31
31 -
 32
32 -
 33
33 -
 34
34 -
 35
35 -
 36
36 -
 37
37 -
 38
38 -
 39
39 -
 40
40 -
41
-
42
-
43
-
44
-
45
-
46
-
47
-
48
-
49
-
50
-
51
-
52
-
53
-
54
-
55
-
56
-
57
-
58
-
59
-
60
-
61
-
62
-
63
-
64
-
65
-
66
-
67
-
68
-
69
-
70
-
71
-
72
-
73
-
74
-
75
-
76
-
77
-
78
-
79
-
80
-
81
-
82
-
83
-
84
-
85
-
86
-
87
-
88
-
89
-
90
-
91
-
92
-
93
-
94
-
95
-
96
-
97
-
98
-
99
-
100
-
101
-
102
-
103
-
104
-
105
-
106
-
107
-
108
-
109
-
110
-
111
-
112
-
113
-
114
-
115
-
116
-
117
-
118
-
119
-
120
-
121
-
122
-
123
-
124
-
125
-
126
-
127
-
128
-
129
-
130
-
131
-
132
-
133
-
134
-
135
-
136
-
137
-
138
-
139
-
140
-
141
-
142
-
143
-
144
-
145
-
146
-
147
-
148
-
149
-
150
-
151
-
152
-
153
-
154
-
155
-
156
-
157
-
158
-
159
-
160
-
161
-
162
-
163
-
164
-
165
-
166
-
167
-
168
-
169
-
170
-
171
 |
 |

Fiscal Year 2007 Highlights
We believe that our product assortment of luxury, designer and fashion merchandise, coupled with our sales promotion activities
and our commitment to superior customer service, have been critical to our success in the past. In addition, we believe these factors are
critical to our future growth and success. Highlights from fiscal year 2007 include:
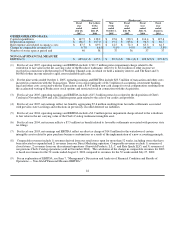
• Increases in revenues—Our revenues for fiscal year 2007 were $4,390.1 million, the highest in our history. Revenues
increased by 8.9% in fiscal year 2007 as compared to fiscal year 2006. This increase was attributable to 1) increases in
comparable revenues, 2) revenues from new stores and 3) higher internet sales.
Comparable revenues increased 6.7% in fiscal year 2007 and were achieved on top of increases in comparable revenues of
7.3% in fiscal year 2006. Comparable revenues percentage increases by fiscal quarter for fiscal year 2007 as compared to
the same periods in fiscal year 2006 were:
First fiscal quarter 6.8%
Second fiscal quarter 6.8%
Third fiscal quarter 6.1%
Fourth fiscal quarter 7.0%
For Specialty Retail stores, our sales per square foot increased by 4.4% to $638 in fiscal year 2007 compared to $611 in
fiscal year 2006.
• Decreases in cost of goods sold including buying and occupancy costs (excluding depreciation)—COGS represented
62.7% of revenues in fiscal year 2007 and 64.3% of revenues in fiscal year 2006. This decrease is primarily due to non-cash
purchase accounting adjustments in fiscal year 2006 of $38.1 million, or 0.9% of revenues. Excluding the impact of
purchase accounting adjustments, COGS decreased by 0.7% of revenues in fiscal year 2007. The fiscal year 2007 decrease
in COGS was achieved on top of a decrease in COGS of 0.2% of revenues in fiscal year 2006. We believe these decreases
are reflective of a both lower product costs and a lower level of markdowns required in the Fall Season of fiscal year 2007
as well as our continuing emphasis on full-price sales and inventory management.
• Decreases in selling, general and administrative expenses (excluding depreciation)—SG&A decreased in fiscal year
2007 to 23.1% of revenues from 23.8% of revenues in fiscal year 2006. The fiscal 2007 decrease in SG&A was achieved
on top of a decrease in SG&A of 0.8% of revenues in fiscal year 2006. We believe these decreases are reflective of both
our continued leveraging of certain costs, primarily advertising, and emphasis on expense containment and control.
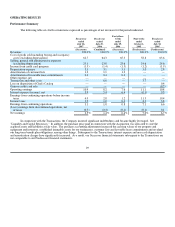
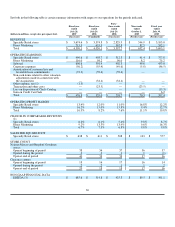
• Increases in operating earnings—For fiscal year 2007, our operating earnings were $476.8 million, or 10.9% of revenues,
compared to $329.0 million, or 8.2% of revenues, for fiscal year 2006. Fiscal year 2007 operating earnings increased
primarily due to 1) an increase of $104.7 million in the operating earnings generated by our Specialty Retail Stores and
Direct Marketing segments given the year-over-year increases in revenues, gross margins achieved and expense leveraging,
2) a decrease of $23.5 million in transaction costs incurred in the first quarter of fiscal year 2006 and 3) a $21.7 million net
decrease in non-cash items related to the amortization of intangible assets and other asset valuation adjustments recorded in
connection with the Acquisition.
27