Neiman Marcus 2006 Annual Report Download - page 24
Download and view the complete annual report
Please find page 24 of the 2006 Neiman Marcus annual report below. You can navigate through the pages in the report by either clicking on the pages listed below, or by using the keyword search tool below to find specific information within the annual report.-
 1
1 -
2
-
3
-
4
-
5
-
6
-
7
-
8
-
9
-
10
-
11
-
12
-
13
-
 14
14 -
 15
15 -
 16
16 -
 17
17 -
 18
18 -
 19
19 -
 20
20 -
 21
21 -
 22
22 -
 23
23 -
 24
24 -
 25
25 -
 26
26 -
 27
27 -
 28
28 -
 29
29 -
 30
30 -
 31
31 -
 32
32 -
 33
33 -
 34
34 -
35
-
36
-
37
-
38
-
39
-
40
-
41
-
42
-
43
-
44
-
45
-
46
-
47
-
48
-
49
-
50
-
51
-
52
-
53
-
54
-
55
-
56
-
57
-
58
-
59
-
60
-
61
-
62
-
63
-
64
-
65
-
66
-
67
-
68
-
69
-
70
-
71
-
72
-
73
-
74
-
75
-
76
-
77
-
78
-
79
-
80
-
81
-
82
-
83
-
84
-
85
-
86
-
87
-
88
-
89
-
90
-
91
-
92
-
93
-
94
-
95
-
96
-
97
-
98
-
99
-
100
-
101
-
102
-
103
-
104
-
105
-
106
-
107
-
108
-
109
-
110
-
111
-
112
-
113
-
114
-
115
-
116
-
117
-
118
-
119
-
120
-
121
-
122
-
123
-
124
-
125
-
126
-
127
-
128
-
129
-
130
-
131
-
132
-
133
-
134
-
135
-
136
-
137
-
138
-
139
-
140
-
141
-
142
-
143
-
144
-
145
-
146
-
147
-
148
-
149
-
150
-
151
-
152
-
153
-
154
-
155
-
156
-
157
-
158
-
159
-
160
-
161
-
162
-
163
-
164
-
165
-
166
-
167
-
168
-
169
-
170
-
171
 |
 |
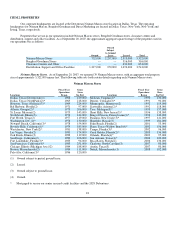
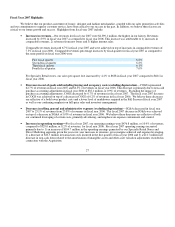
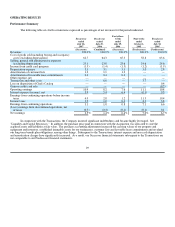
PART II
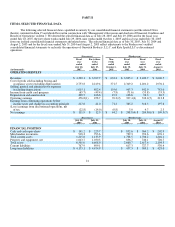
ITEM 6. SELECTED FINANCIAL DATA
The following selected financial data is qualified in entirety by our consolidated financial statements (and the related Notes
thereto) contained in Item 15 and should be read in conjunction with "Management's Discussion and Analysis of Financial Condition and
Results of Operations" in Item 7. We derived the selected financial data as of July 28, 2007 and July 29, 2006 and for the fiscal year
ended July 28, 2007, the forty-three weeks ended July 29, 2006, nine weeks ended October 1, 2005 and fiscal year ended July 30, 2005
from our audited consolidated financial statements and related notes. The selected financial data as of July 30, 2005, July 31, 2004 and
August 2, 2003 and for the fiscal years ended July 31, 2004 and August 2, 2003 reflect adjustments to the Predecessor's audited
consolidated financial statements to reclassify the operations of Gurwitch Products, L.L.C. and Kate Spade LLC as discontinued
operations.
(Successor) (Predecessor)
(in thousands)
Fiscal
year
ended
July 28,
2007
Forty-three
weeks
ended
July 29,
2006
Nine
weeks
ended
October 1,
2005
Fiscal
year
ended
July 30,
2005
Fiscal
year
ended
July 31,
2004
Fiscal
year
ended
August 2,
2003
OPERATING RESULTS
Revenues $ 4,390.1 $ 3,397.7 $ 632.4 $ 3,695.1 $ 3,420.7 $ 3,000.5
Cost of goods sold including buying and
occupancy costs (excluding depreciation) 2,753.8 2,219.4 371.5 2,349.2 2,201.2 1,976.2
Selling, general and administrative expenses
(excluding depreciation) 1,015.1 802.4 155.6 907.3 842.9 783.0
Income from credit card program (65.7) (49.4) (7.8) (71.6) (55.8) (53.3)
Depreciation and amortization 208.7 166.6 19.2 103.6 96.3 80.7
Operating earnings 476.8(1) 258.7 70.3(2) 397.4(3) 332.2(5) 213.8
Earnings from continuing operations before
income taxes and change in accounting principle 217.0 41.0 71.2 385.2 316.3 197.6
(Loss) earnings from discontinued operations, net
of tax (22.8) (14.0) (0.8) 5.0 4.7 2.5
Net earnings $ 111.9 $ 12.5 $ 44.2 $ 248.8(4) $ 204.8(6) $ 109.3(7)
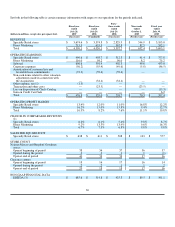
(Successor) (Predecessor)
July 28,
2007
July 29,
2006
July 30,
2005
July 31,
2004
August 2,
2003
FINANCIAL POSITION
Cash and cash equivalents $ 141.2 $ 223.7 $ 852.6 $ 364.2 $ 202.9
Merchandise inventories 918.3 793.6 729.3 703.6 676.1
Total current assets 1,215.0 1,135.9 1,708.5 1,706.2 1,246.1
Property and equipment, net 1,043.7 1,030.3 836.7 740.1 726.7
Total assets 6,501.0 6,608.0 2,660.7 2,617.6 2,104.5
Current liabilities 767.9 699.1 617.3 727.7 530.4
Long-term liabilities $ 4,175.1 $ 4,474.9 $ 457.3 $ 509.1 $ 428.0
21