Neiman Marcus 2006 Annual Report Download - page 104
Download and view the complete annual report
Please find page 104 of the 2006 Neiman Marcus annual report below. You can navigate through the pages in the report by either clicking on the pages listed below, or by using the keyword search tool below to find specific information within the annual report.-
 1
1 -
2
-
3
-
4
-
5
-
6
-
7
-
8
-
9
-
10
-
11
-
12
-
13
-
14
-
15
-
16
-
17
-
18
-
19
-
20
-
21
-
22
-
23
-
24
-
25
-
26
-
27
-
28
-
29
-
30
-
31
-
32
-
33
-
34
-
35
-
36
-
37
-
38
-
39
-
40
-
41
-
42
-
43
-
44
-
45
-
46
-
47
-
48
-
49
-
50
-
51
-
52
-
53
-
54
-
55
-
56
-
57
-
58
-
59
-
60
-
61
-
62
-
63
-
64
-
65
-
66
-
67
-
68
-
69
-
70
-
71
-
72
-
73
-
74
-
75
-
76
-
77
-
78
-
79
-
80
-
81
-
82
-
83
-
84
-
85
-
86
-
87
-
88
-
89
-
90
-
91
-
92
-
93
-
 94
94 -
 95
95 -
 96
96 -
 97
97 -
 98
98 -
 99
99 -
 100
100 -
 101
101 -
 102
102 -
 103
103 -
 104
104 -
 105
105 -
 106
106 -
 107
107 -
 108
108 -
 109
109 -
 110
110 -
 111
111 -
 112
112 -
 113
113 -
 114
114 -
115
-
116
-
117
-
118
-
119
-
120
-
121
-
122
-
123
-
124
-
125
-
126
-
127
-
128
-
129
-
130
-
131
-
132
-
133
-
134
-
135
-
136
-
137
-
138
-
139
-
140
-
141
-
142
-
143
-
144
-
145
-
146
-
147
-
148
-
149
-
150
-
151
-
152
-
153
-
154
-
155
-
156
-
157
-
158
-
159
-
160
-
161
-
162
-
163
-
164
-
165
-
166
-
167
-
168
-
169
-
170
-
171
 |
 |

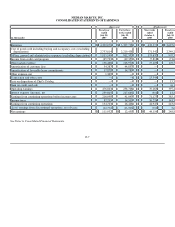
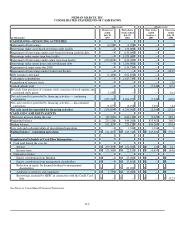
NEIMAN MARCUS, INC.
CONSOLIDATED STATEMENTS OF CASH FLOWS
(Successor) (Predecessor)
(in thousands)
Fiscal year
ended
July 28,
2007
Forty-three
weeks ended
July 29,
2006
Nine weeks
ended
October 1,
2005
Fiscal year
ended
July 30,
2005
CASH FLOWS—OPERATING ACTIVITIES
Net earnings $ 111,932 $ 12,455 $ 44,154 $ 248,824
Loss (earnings) from discontinued operations 22,771 13,993 793 (5,020
Adjustments to reconcile net earnings to net cash provided by operating
activities:
Depreciation 136,468 106,950 19,209 103,589
Amortization of debt issue costs 14,141 11,728 96 831
Amortization of customer lists and favorable lease commitments 72,265 59,640 — —
Non-cash charges related to step-up in carrying value of inventory — 38,067 — —
Stock-based compensation charges 5,859 3,951 19,968 —
Deferred income taxes (60,522 ) (65,620 ) (7,318 ) (15,925
Loss on disposition of Chef's Catalog — — — 15,348
Gain on Credit Card Sale — — — (6,170
Net cash received from Credit Card Sale — — — 533,656
Impairment of Horchow tradename 11,473 — — —
Other—primarily costs related to defined benefit pension and other
long-term benefit plans 14,672 15,079 (4,224 )42,068
329,059 196,243 72,678 917,201
Changes in operating assets and liabilities:
(Increase) decrease in merchandise inventories (124,648 ) 107,829 (172,924 ) (36,016
(Increase) decrease in other current assets (45,392 ) 2,117 (881 ) (73,924
(Increase) decrease in other assets (3,333 ) 5,627 (2,274 ) 10,743
Increase in accounts payable and accrued liabilities 86,256 61,163 122,608 20,112
Increase in deferred real estate credits 27,885 25,068 4,326 13,782
Payment of deferred compensation and stock-based awards — (12,901 ) — —
Funding of defined benefit pension plan — — — (20,000
Net cash provided by operating activities — continuing operations 269,827 385,146 23,533 831,898
Net cash (used for) provided by operating activities — discontinued
operations (10,918 )(4,381 ) (4,098 )13,502
Net cash provided by operating activities 258,909 380,765 19,435 845,400
CASH FLOWS—INVESTING ACTIVITIES
Capital expenditures (147,877 ) (138,212 ) (25,575 ) (190,255
Payment to minority interest holder in Kate Spade LLC (59,400 ) — — —
Net proceeds from sale of Kate Spade LLC 121,469 — — —
Acquisition of The Neiman Marcus Group, Inc. — (5,156,423 ) — —
Proceeds from sale of Gurwitch Products, L.L.C. — 40,752 — —
Net increase in cash restricted for repayment of borrowings under
Credit Card Facility — — — (40,713
Proceeds from sale of Chef's Catalog and other assets — — — 14,419
Net cash used for investing activities — continuing operations (85,808 ) (5,253,883 ) (25,575 ) (216,549
Net cash used for investing activities — discontinued operations (128 )(5,919 ) (736 )(12,280
Net cash used for investing activities (85,936 )(5,259,802 ) (26,311 )(228,829
F-8