Neiman Marcus 2006 Annual Report Download - page 147
Download and view the complete annual report
Please find page 147 of the 2006 Neiman Marcus annual report below. You can navigate through the pages in the report by either clicking on the pages listed below, or by using the keyword search tool below to find specific information within the annual report.-
 1
1 -
2
-
3
-
4
-
5
-
6
-
7
-
8
-
9
-
10
-
11
-
12
-
13
-
14
-
15
-
16
-
17
-
18
-
19
-
20
-
21
-
22
-
23
-
24
-
25
-
26
-
27
-
28
-
29
-
30
-
31
-
32
-
33
-
34
-
35
-
36
-
37
-
38
-
39
-
40
-
41
-
42
-
43
-
44
-
45
-
46
-
47
-
48
-
49
-
50
-
51
-
52
-
53
-
54
-
55
-
56
-
57
-
58
-
59
-
60
-
61
-
62
-
63
-
64
-
65
-
66
-
67
-
68
-
69
-
70
-
71
-
72
-
73
-
74
-
75
-
76
-
77
-
78
-
79
-
80
-
81
-
82
-
83
-
84
-
85
-
86
-
87
-
88
-
89
-
90
-
91
-
92
-
93
-
94
-
95
-
96
-
97
-
98
-
99
-
100
-
101
-
102
-
103
-
104
-
105
-
106
-
107
-
108
-
109
-
110
-
111
-
112
-
113
-
114
-
115
-
116
-
117
-
118
-
119
-
120
-
121
-
122
-
123
-
124
-
125
-
126
-
127
-
128
-
129
-
130
-
131
-
132
-
133
-
134
-
135
-
136
-
 137
137 -
 138
138 -
 139
139 -
 140
140 -
 141
141 -
 142
142 -
 143
143 -
 144
144 -
 145
145 -
 146
146 -
 147
147 -
 148
148 -
 149
149 -
 150
150 -
 151
151 -
 152
152 -
 153
153 -
 154
154 -
 155
155 -
 156
156 -
 157
157 -
158
-
159
-
160
-
161
-
162
-
163
-
164
-
165
-
166
-
167
-
168
-
169
-
170
-
171
 |
 |

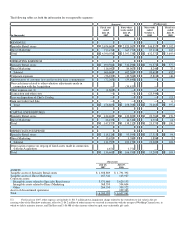
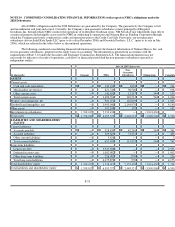
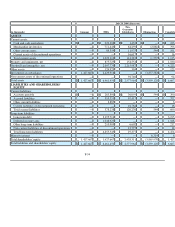
Fiscal year ended July 30, 2005 (Predecessor)
(in thousands) NMG
Guarantor
Subsidiaries
Non-Guarantor
Subsidiaries Eliminations Consolidated
Revenues $ 3,175,675 $ 518,492 $ 907 $ — $ 3,695,074
Cost of goods sold including buying and occupancy
costs (excluding depreciation) 2,009,096 339,543 568 — 2,349,207
Selling, general and administrative expenses
(excluding depreciation) 796,060 112,101 (855 ) — 907,306
Income from credit card program — — (71,644 ) — (71,644
Depreciation expense 84,832 18,301 456 — 103,589
Loss on disposition of Chef's Catalog 7,048 8,300 — — 15,348
Gain on credit card sale — — (6,170 )— (6,170
Operating earnings 278,639 40,247 78,552 — 397,438
Interest expense, net 7,019 — 5,242 — 12,261
Intercompany royalty charges (income) 195,572 (195,572 ) — —
Equity in earnings of subsidiaries (314,149 )— — 314,149
Earnings (loss) from continuing operations before
income taxes 390,197 235,819 73,310 (314,149 ) 385,177
Income taxes 141,373 — — — 141,373
Earnings (loss) from continuing operations 248,824 235,819 73,310 (314,149 ) 243,804
Earnings (loss) from discontinued operations, net of
taxes — — 8,857 (3,837 )5,020
Net earnings (loss) $ 248,824 $ 235,819 $ 82,167 $ (317,986 )$ 248,824
F-48