Neiman Marcus 2006 Annual Report Download - page 36
Download and view the complete annual report
Please find page 36 of the 2006 Neiman Marcus annual report below. You can navigate through the pages in the report by either clicking on the pages listed below, or by using the keyword search tool below to find specific information within the annual report.-
 1
1 -
2
-
3
-
4
-
5
-
6
-
7
-
8
-
9
-
10
-
11
-
12
-
13
-
14
-
15
-
16
-
17
-
18
-
19
-
20
-
21
-
22
-
23
-
24
-
25
-
 26
26 -
 27
27 -
 28
28 -
 29
29 -
 30
30 -
 31
31 -
 32
32 -
 33
33 -
 34
34 -
 35
35 -
 36
36 -
 37
37 -
 38
38 -
 39
39 -
 40
40 -
 41
41 -
 42
42 -
 43
43 -
 44
44 -
 45
45 -
 46
46 -
47
-
48
-
49
-
50
-
51
-
52
-
53
-
54
-
55
-
56
-
57
-
58
-
59
-
60
-
61
-
62
-
63
-
64
-
65
-
66
-
67
-
68
-
69
-
70
-
71
-
72
-
73
-
74
-
75
-
76
-
77
-
78
-
79
-
80
-
81
-
82
-
83
-
84
-
85
-
86
-
87
-
88
-
89
-
90
-
91
-
92
-
93
-
94
-
95
-
96
-
97
-
98
-
99
-
100
-
101
-
102
-
103
-
104
-
105
-
106
-
107
-
108
-
109
-
110
-
111
-
112
-
113
-
114
-
115
-
116
-
117
-
118
-
119
-
120
-
121
-
122
-
123
-
124
-
125
-
126
-
127
-
128
-
129
-
130
-
131
-
132
-
133
-
134
-
135
-
136
-
137
-
138
-
139
-
140
-
141
-
142
-
143
-
144
-
145
-
146
-
147
-
148
-
149
-
150
-
151
-
152
-
153
-
154
-
155
-
156
-
157
-
158
-
159
-
160
-
161
-
162
-
163
-
164
-
165
-
166
-
167
-
168
-
169
-
170
-
171
 |
 |

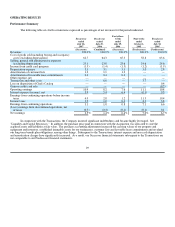
in buying and occupancy costs required to support the growth in sales.
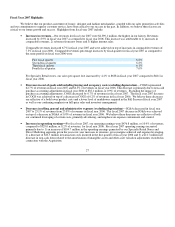
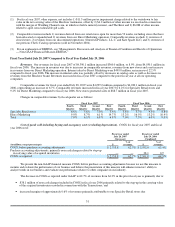
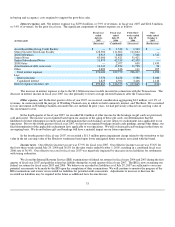
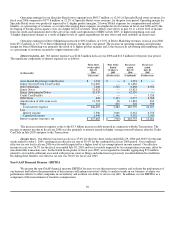
Interest expense, net. Net interest expense was $259.8 million, or 5.9% of revenues, in fiscal year 2007 and $216.8 million,
or 5.4% of revenues, for the prior fiscal year. The significant components of interest expense are as follows:
(in thousands)
Fiscal year
ended
July 28,
2007
Fiscal year
ended
July 29,
2006
Forty-three
weeks ended
July 29,
2006
Nine
weeks ended
October 1,
2005
(Successor) (Combined) (Successor) (Predecessor)
Asset-Based Revolving Credit Facility $ — $ 1,332 $ 1,332 $ —
Senior Secured Term Loan Facility 128,380 111,662 111,662 —
2028 Debentures 8,915 8,808 7,266 1,542
Senior Notes 63,000 51,421 51,421 —
Senior Subordinated Notes 51,875 42,339 42,339 —
2008 Notes — 2,077 638 1,439
Amortization of debt issue costs 14,141 11,824 11,728 96
Other 3,689 316 111 205
Total interest expense 270,000 229,779 226,497 3,282
Less:
Interest income 7,370 8,432 5,386 3,046
Capitalized interest 2,825 4,592 3,446 1,146
Interest expense (income), net $ 259,805 $ 216,755 $ 217,665 $ (910)
The increase in interest expense is due to the $3.3 billion increase in debt incurred in connection with the Transactions. The
decrease in interest income in fiscal year 2007 was due primarily to lower average invested balances after the Transactions.
Other expense, net. In the first quarter of fiscal year 2007, we received consideration aggregating $4.2 million, or 0.1% of
revenues, in connection with the merger of Wedding Channel.com, in which we held a minority interest, and The Knot. We accounted
for our investment in Wedding Channel.com under the cost method. In prior years, we had previously reduced our carrying value of
this investment to zero.
In the fourth quarter of fiscal year 2007, we recorded $6.0 million of other income for the breakage on gift cards we previously
sold and issued. The income was recognized based upon our analysis of the aging of these gift cards, our determination that the
likelihood of future redemption is remote and our determination that such balances are not subject to escheatment laws applicable to our
operations. Prior to the fourth quarter of fiscal year 2007, we had not recognized breakage on gift cards pending, among other things, our
final determination of the applicable escheatment laws applicable to our operations. We will evaluate gift card breakage in the future on
an ongoing basis. We do not believe gift card breakage will have a material impact on our future operations.
In the fourth quarter of fiscal year 2007, we recorded a $11.5 million pretax impairment charge related to the writedown to fair
value in the net carrying value of the Horchow tradename based upon lower anticipated future revenues associated with the brand.
Income taxes. Our effective income tax rate was 37.9% for fiscal year 2007. Our effective income tax rate was 35.6% for
the forty-three weeks ended July 29, 2006 and 36.8% for the nine weeks ended October 1, 2005, resulting in a combined fiscal year
2006 rate of 36.4%. Our effective tax rate for fiscal year 2007 was negatively impacted by increases in tax liabilities for settlements
with taxing authorities.
We closed the Internal Revenue Service (IRS) examinations of federal tax returns for fiscal years 2004 and 2003 during the first
quarter of fiscal year 2007 and paid the related tax liability during the second quarter of fiscal year 2007. The IRS is now examining our
federal tax returns for fiscal years 2005 and 2006. We believe our recorded tax liabilities as of July 28, 2007 are sufficient to cover any
potential assessments to be made by the IRS upon the completion of their examinations. We will continue to monitor the progress of the
IRS examinations and review our recorded tax liabilities for potential audit assessments. Adjustments to increase or decrease the
recorded tax liabilities may be required in the future as additional facts become known.
33