Motorola 2013 Annual Report Download - page 95
Download and view the complete annual report
Please find page 95 of the 2013 Motorola annual report below. You can navigate through the pages in the report by either clicking on the pages listed below, or by using the keyword search tool below to find specific information within the annual report.-
 1
1 -
2
-
3
-
4
-
5
-
6
-
7
-
8
-
9
-
10
-
11
-
12
-
13
-
14
-
15
-
16
-
17
-
18
-
19
-
20
-
21
-
22
-
23
-
24
-
25
-
26
-
27
-
28
-
29
-
30
-
31
-
32
-
33
-
34
-
35
-
36
-
37
-
38
-
39
-
40
-
41
-
42
-
43
-
44
-
45
-
46
-
47
-
48
-
49
-
50
-
51
-
52
-
53
-
54
-
55
-
56
-
57
-
58
-
59
-
60
-
61
-
62
-
63
-
64
-
65
-
66
-
67
-
68
-
69
-
70
-
71
-
72
-
73
-
74
-
75
-
76
-
77
-
78
-
79
-
80
-
81
-
82
-
83
-
84
-
 85
85 -
 86
86 -
 87
87 -
 88
88 -
 89
89 -
 90
90 -
 91
91 -
 92
92 -
 93
93 -
 94
94 -
 95
95 -
 96
96 -
 97
97 -
 98
98 -
 99
99 -
 100
100 -
 101
101 -
 102
102 -
 103
103 -
 104
104 -
 105
105 -
106
-
107
-
108
-
109
-
110
-
111
 |
 |

93
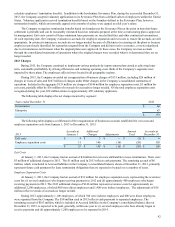
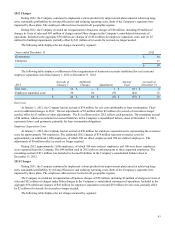
2012 Charges
During 2012, the Company continued to implement various productivity improvement plans aimed at achieving long-
term, sustainable profitability by driving efficiencies and reducing operating costs. Both of the Company’s segments were
impacted by these plans. The employees affected were located in all geographic regions.
During 2012, the Company recorded net reorganization of business charges of $50 million, including $9 million of
charges in Costs of sales and $41 million of charges under Other charges in the Company’s consolidated statements of
operations. Included in the aggregate $50 million are charges of (i) $54 million for employee separation costs, and (ii) $7
million for building impairments, partially offset by $11 million of reversals for accruals no longer needed.
The following table displays the net charges incurred by segment:
Years ended December 31 2012
Government $ 33
Enterprise 17
$ 50
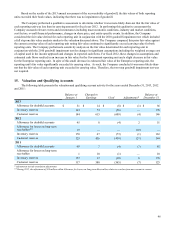
The following table displays a rollforward of the reorganization of businesses accruals established for exit costs and
employee separation costs from January 1, 2012 to December 31, 2012:
2012 Accruals at
January 1 Additional
Charges Adjustments Amount
Used Accruals at
December 31
Exit costs $ 14 $ — $ 1 $ (11) $ 4
Employee separation costs 30 54 (9)(44) 31
$ 44 $ 54 $ (8) $ (55) $ 35
Exit Costs
At January 1, 2012, the Company had an accrual of $14 million for exit costs attributable to lease terminations. There
were no additional charges in 2012. The net adjustments of $1 million reflect $2 million of reversals of accruals no longer
needed, offset by $3 million of other adjustments. The $11 million used in 2012 reflects cash payments. The remaining accrual
of $4 million, which was included in Accrued liabilities in the Company’s consolidated balance sheet at December 31, 2012,
represents future cash payments, primarily for lease termination obligations.
Employee Separation Costs
At January 1, 2012, the Company had an accrual of $30 million for employee separation costs, representing the severance
costs for approximately 700 employees. The additional 2012 charges of $54 million represent severance costs for
approximately an additional 1,000 employees, of which 300 are direct employees and 700 are indirect employees. The
adjustments of $9 million reflect accruals no longer required.
During 2012, approximately 1,000 employees, of which 700 were indirect employees and 300 were direct employees,
were separated from the Company. The $44 million used in 2012 reflects cash payments to these separated employees. The
remaining accrual of $31 million was included in Accrued liabilities in the Company’s consolidated balance sheet at
December 31, 2012.
2011 Charges
During 2011, the Company continued to implement various productivity improvement plans aimed at achieving long-
term, sustainable profitability by driving efficiencies and reducing operating costs. Both of the Company’s segments were
impacted by these plans. The employees affected were located in all geographic regions.
The Company recorded net reorganization of business charges of $58 million, including $6 million of charges in Costs of
sales and $52 million of charges under Other charges in the Company’s consolidated statements of operations. Included in the
aggregate $58 million are charges of $41 million for employee separation costs and $19 million for exit costs, partially offset
by $2 million of reversals for accruals no longer needed.
The following table displays the net charges incurred by segment: