Motorola 2013 Annual Report Download - page 33
Download and view the complete annual report
Please find page 33 of the 2013 Motorola annual report below. You can navigate through the pages in the report by either clicking on the pages listed below, or by using the keyword search tool below to find specific information within the annual report.-
 1
1 -
2
-
3
-
4
-
5
-
6
-
7
-
8
-
9
-
10
-
11
-
12
-
13
-
14
-
15
-
16
-
17
-
18
-
19
-
20
-
21
-
22
-
 23
23 -
 24
24 -
 25
25 -
 26
26 -
 27
27 -
 28
28 -
 29
29 -
 30
30 -
 31
31 -
 32
32 -
 33
33 -
 34
34 -
 35
35 -
 36
36 -
 37
37 -
 38
38 -
 39
39 -
 40
40 -
 41
41 -
 42
42 -
 43
43 -
44
-
45
-
46
-
47
-
48
-
49
-
50
-
51
-
52
-
53
-
54
-
55
-
56
-
57
-
58
-
59
-
60
-
61
-
62
-
63
-
64
-
65
-
66
-
67
-
68
-
69
-
70
-
71
-
72
-
73
-
74
-
75
-
76
-
77
-
78
-
79
-
80
-
81
-
82
-
83
-
84
-
85
-
86
-
87
-
88
-
89
-
90
-
91
-
92
-
93
-
94
-
95
-
96
-
97
-
98
-
99
-
100
-
101
-
102
-
103
-
104
-
105
-
106
-
107
-
108
-
109
-
110
-
111
 |
 |
31
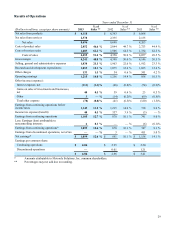
Gains on Sales of Investments and Businesses
Gains on sales of investments and businesses were $40 million in 2013, compared to $39 million in 2012. These gains
consist of gains on the sale of multiple equity investments in both 2013 and 2012.
Other
Net Other income was $3 million in 2013, compared to net Other expense of $14 million in 2012. The net Other income in
2013 was primarily comprised of: (i) $10 million of equity method investment earnings and (ii) $11 million of other non-
operating gains, partially offset by: (i) a $12 million loss on foreign currency and (ii) investment impairments of $6 million.
The net Other expense in 2012 was primarily comprised of: (i) a $13 million loss on foreign currency, (ii) investment
impairments of $8 million, and (iii) a $6 million loss from the extinguishment of debt, partially offset by $13 million of other
net investment earnings.
Effective Tax Rate
We recorded $40 million of net tax expense in 2013, resulting in an effective tax rate of 3%, compared to $337 million of
net tax expense in 2012, resulting in an effective tax rate of 28%. Our effective tax rate in 2013 was favorably impacted by: (i)
$337 million of net tax benefit, or $1.25 of diluted earnings per share, associated with excess foreign tax credits realized upon
repatriation of foreign earnings, (ii) a $25 million reduction in our deferred tax liability for undistributed foreign earnings
primarily due to our assertion that certain earnings are now permanently reinvested, and (iii) a $14 million tax benefit for prior
year R&D tax credits. Our effective tax rate in 2013 was unfavorably impacted by a $20 million tax charge associated with the
liquidation of the Sigma Fund, as discussed within "Liquidity and Capital Resources."
The tax benefit for excess foreign tax credits relates to the repatriation of foreign earnings of certain non-U.S. subsidiaries
reorganized under our recently implemented holding company structure.
Our effective tax rate in 2012 was lower than the U.S. statutory tax rate of 35% primarily due to: (i) a $60 million tax
benefit related to the reversal of a significant portion of the valuation allowance established on certain foreign deferred tax
assets and (ii) a $13 million reduction in unrecognized tax benefits for facts that then indicated the extent to which certain tax
positions were more-likely-than-not of being sustained.
Our effective tax rate will change from period to period based on non-recurring events, such as the settlement of income
tax audits, changes in valuation allowances and the tax impact of significant unusual or extraordinary items, as well as
recurring factors including changes in the geographic mix of income and effects of various global income tax strategies.
Earnings from Continuing Operations
After taxes, we had net earnings from continuing operations of $1.1 billion, or $4.06 per diluted share, in 2013, compared
to net earnings from continuing operations of $878 million, or $2.95 per diluted share, in 2012.
The increase in net earnings from continuing operations in 2013, as compared to 2012, was primarily driven by: (i) a
lower effective tax rate due to the $337 million of net tax benefit associated with foreign tax credits realized upon repatriation
of foreign earnings and (ii) decreased defined benefit expenses of over $100 million, partially offset by: (i) a $107 million
decrease in gross margin, (ii) a $83 million increase in reorganization charges, and (iii) a $47 million increase in net interest
expense. The increase in earnings per diluted share was driven by higher net earnings and the reduction in shares outstanding
as a result of our share repurchase program.
Earnings from Discontinued Operations
In 2013, we had no earnings from discontinued operations, compared to $3 million of earnings from discontinued
operations, or $0.01 per diluted share, in 2012. The earnings from discontinued operations in 2012 were primarily driven by a
purchase price adjustment of a previously disposed business, offset by a loss related to the exit of the amateur, marine and
airband business.
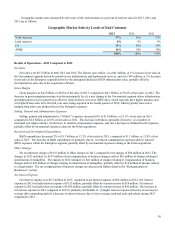
Results of Operations—2012 Compared to 2011
Net Sales
Net sales were $8.7 billion in 2012, a 6% increase compared to net sales of $8.2 billion in 2011. The increase in net sales
reflects: (i) a $631 million, or 12% increase in net sales in the Government segment driven by broad based growth across the
product portfolio and (ii) a $136 million, or 5% decrease in net sales in the Enterprise segment driven by the anticipated decline
in iDEN sales, reduced information technology spending driven by macroeconomic uncertainty, and unfavorable foreign
currency fluctuations.