Motorola 2013 Annual Report Download - page 85
Download and view the complete annual report
Please find page 85 of the 2013 Motorola annual report below. You can navigate through the pages in the report by either clicking on the pages listed below, or by using the keyword search tool below to find specific information within the annual report.-
 1
1 -
2
-
3
-
4
-
5
-
6
-
7
-
8
-
9
-
10
-
11
-
12
-
13
-
14
-
15
-
16
-
17
-
18
-
19
-
20
-
21
-
22
-
23
-
24
-
25
-
26
-
27
-
28
-
29
-
30
-
31
-
32
-
33
-
34
-
35
-
36
-
37
-
38
-
39
-
40
-
41
-
42
-
43
-
44
-
45
-
46
-
47
-
48
-
49
-
50
-
51
-
52
-
53
-
54
-
55
-
56
-
57
-
58
-
59
-
60
-
61
-
62
-
63
-
64
-
65
-
66
-
67
-
68
-
69
-
70
-
71
-
72
-
73
-
74
-
 75
75 -
 76
76 -
 77
77 -
 78
78 -
 79
79 -
 80
80 -
 81
81 -
 82
82 -
 83
83 -
 84
84 -
 85
85 -
 86
86 -
 87
87 -
 88
88 -
 89
89 -
 90
90 -
 91
91 -
 92
92 -
 93
93 -
 94
94 -
 95
95 -
96
-
97
-
98
-
99
-
100
-
101
-
102
-
103
-
104
-
105
-
106
-
107
-
108
-
109
-
110
-
111
 |
 |

83
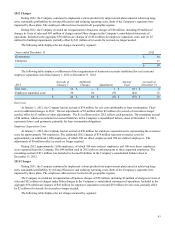
Restricted Stock and Restricted Stock Units
Restricted stock (“RS”) and restricted stock unit (“RSU”) grants consist of shares or the rights to shares of the Company’s
common stock which are awarded to employees and non-employee directors. The grants are restricted such that they are subject
to substantial risk of forfeiture and to restrictions on their sale or other transfer by the employee. Shares of RS and RSUs
assumed or replaced with comparable shares of RS or RSUs in conjunction with a change in control will only have the
restrictions lapse if the holder is also involuntarily terminated (for a reason other than cause) or quits for good reason within
24 months of a change in control.
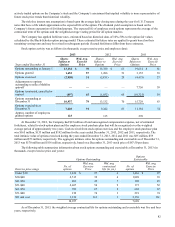
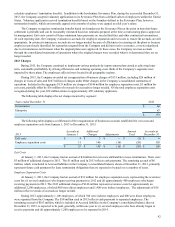
Restricted stock and restricted stock unit activity was as follows (in thousands, except fair value and employee data):
2013 2012 2011
Years ended December 31 RS and RSU
Wtd. Avg.
Grant
Date Fair
Value RS and RSU
Wtd Avg.
Grant
Date Fair
Value RS and RSU
Wtd Avg.
Grant
Date Fair
Value
RS and RSU outstanding at
January 1 6,299 $ 41 8,990 $ 40 9,559 $ 51
Granted 1,558 54 1,657 49 5,150 44
Adjustments to RSUs
outstanding to reflect Mobility
spin-off — — — — 3,638 20
Vested (3,610) 38 (3,845) 41 (3,230) 31
Terminated, canceled or expired (519) 45 (503) 33 (6,127) 44
RS and RSU outstanding at
December 31 3,728 49 6,299 41 8,990 40
Approx. number of employees
granted RSUs 2,295 2,355 12,351
At December 31, 2013, the Company had unrecognized compensation expense related to RS and RSUs of $107 million,
net of estimated forfeitures, expected to be recognized over the weighted average period of approximately two years. The total
fair value of RS and RSU shares vested during the years ended December 31, 2013, 2012 and 2011 was $138 million, $144
million and $146 million, respectively. The aggregate fair value of outstanding RS and RSUs as of December 31, 2013 was
$252 million. Pursuant to the completion of the distribution of Motorola Mobility on January 4, 2011, approximately 3.8
million unvested RSUs held by the employees of Motorola Mobility were cancelled. Upon the completed divestiture of the
Networks business on April 29, 2011, approximately 1.4 million unvested RSUs were cancelled.
Total Share-Based Compensation Expense
Compensation expense for the Company’s employee stock options, stock appreciation rights, employee stock purchase
plans, RS and RSUs was as follows:
Years ended December 31 2013 2012 2011
Share-based compensation expense included in:
Costs of sales $ 20 $ 25 $ 20
Selling, general and administrative expenses 93 112 112
Research and development expenditures 40 47 36
Share-based compensation expense included in Operating earnings 153 184 168
Tax benefit 47 62 51
Share-based compensation expense, net of tax $ 106 $ 122 $ 117
Decrease in basic earnings per share $(0.40)$(0.42) $ (0.34)
Decrease in diluted earnings per share $(0.39)$(0.41) $ (0.34)
Share-based compensation expense in discontinued operations $ — $ — $ 13
At December 31, 2013 and 2012, 20.4 million shares and 22.2 million shares, respectively, were available for future
share-based award grants under the current share-based compensation plan, covering all equity awards to employees and non-
employee directors.