Motorola 2013 Annual Report Download - page 88
Download and view the complete annual report
Please find page 88 of the 2013 Motorola annual report below. You can navigate through the pages in the report by either clicking on the pages listed below, or by using the keyword search tool below to find specific information within the annual report.-
 1
1 -
2
-
3
-
4
-
5
-
6
-
7
-
8
-
9
-
10
-
11
-
12
-
13
-
14
-
15
-
16
-
17
-
18
-
19
-
20
-
21
-
22
-
23
-
24
-
25
-
26
-
27
-
28
-
29
-
30
-
31
-
32
-
33
-
34
-
35
-
36
-
37
-
38
-
39
-
40
-
41
-
42
-
43
-
44
-
45
-
46
-
47
-
48
-
49
-
50
-
51
-
52
-
53
-
54
-
55
-
56
-
57
-
58
-
59
-
60
-
61
-
62
-
63
-
64
-
65
-
66
-
67
-
68
-
69
-
70
-
71
-
72
-
73
-
74
-
75
-
76
-
77
-
 78
78 -
 79
79 -
 80
80 -
 81
81 -
 82
82 -
 83
83 -
 84
84 -
 85
85 -
 86
86 -
 87
87 -
 88
88 -
 89
89 -
 90
90 -
 91
91 -
 92
92 -
 93
93 -
 94
94 -
 95
95 -
 96
96 -
 97
97 -
 98
98 -
99
-
100
-
101
-
102
-
103
-
104
-
105
-
106
-
107
-
108
-
109
-
110
-
111
 |
 |

86
December 31, 2012 Level 1 Level 2 Total
Common stock and equivalents $ 1,592 $ 3 $ 1,595
Commingled equity funds — 1,965 1,965
Preferred stock 9 — 9
Government, agency, and government-sponsored enterprise obligations — 317 317
Other government bonds — 49 49
Corporate bonds — 327 327
Mortgage-backed bonds — 14 14
Commingled bond funds — 1,082 1,082
Commingled short-term investment funds — 58 58
Invested cash — — —
Total investment securities $ 1,601 $ 3,815 $ 5,416
Accrued income receivable 10
Fair value plan assets $ 5,426
The table above includes securities on loan as part of a securities lending arrangement of $117 million of common stock
and equivalents, $260 million of government, agency, and government-sponsored enterprise obligations, and $17 million of
corporate bonds. All securities on loan are fully cash collateralized.
There were no significant transfers between Level 1 and Level 2 during 2013 or 2012.
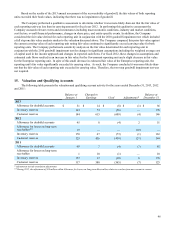
Non-U.S. Pension Benefit Plans
December 31, 2013 Level 1 Level 2 Level 3 Total
Common stock and equivalents $ 208 $ — $ — $ 208
Commingled equity funds — 558 — 558
Government, agency, and government-sponsored
enterprise obligations — 21 3 24
Corporate bonds — 308 23 331
Commingled bond funds — 361 — 361
Commingled short-term investment funds — 11 — 11
Total investment securities $ 208 $ 1,259 $ 26 $ 1,493
Accrued income receivable 61
Insurance contracts* 14
Fair value plan assets $ 1,568
* Comprised of annuity contracts issued by life insurance companies for one of the Company's non-U.S. pension plans
The table above includes securities on loan as part of a securities lending arrangement of $8 million of common stock and
equivalents and $13 million of corporate bonds. All securities on loan are fully collateralized.
The following table summarizes the changes in fair value of the Level 3 assets:
2013
Balance at January 1 $ —
Transfers from Level 2 14
Transfers to Level 2 (2)
Loss on assets held (2)
Payments received for securities sold (4)
Purchases 21
Other (1)
Balance at December 31 $ 26