Motorola 2013 Annual Report Download - page 36
Download and view the complete annual report
Please find page 36 of the 2013 Motorola annual report below. You can navigate through the pages in the report by either clicking on the pages listed below, or by using the keyword search tool below to find specific information within the annual report.-
 1
1 -
2
-
3
-
4
-
5
-
6
-
7
-
8
-
9
-
10
-
11
-
12
-
13
-
14
-
15
-
16
-
17
-
18
-
19
-
20
-
21
-
22
-
23
-
24
-
25
-
 26
26 -
 27
27 -
 28
28 -
 29
29 -
 30
30 -
 31
31 -
 32
32 -
 33
33 -
 34
34 -
 35
35 -
 36
36 -
 37
37 -
 38
38 -
 39
39 -
 40
40 -
 41
41 -
 42
42 -
 43
43 -
 44
44 -
 45
45 -
 46
46 -
47
-
48
-
49
-
50
-
51
-
52
-
53
-
54
-
55
-
56
-
57
-
58
-
59
-
60
-
61
-
62
-
63
-
64
-
65
-
66
-
67
-
68
-
69
-
70
-
71
-
72
-
73
-
74
-
75
-
76
-
77
-
78
-
79
-
80
-
81
-
82
-
83
-
84
-
85
-
86
-
87
-
88
-
89
-
90
-
91
-
92
-
93
-
94
-
95
-
96
-
97
-
98
-
99
-
100
-
101
-
102
-
103
-
104
-
105
-
106
-
107
-
108
-
109
-
110
-
111
 |
 |

34
increased investment in next-generation technologies. As a percentage of net sales in 2012 as compared to 2011, gross margin
increased slightly due to favorable mix, and operating leverage increased primarily due to the 12% increase in net sales while
improving the segment's fixed cost structure.
Enterprise Segment
In 2013, the Enterprise segment’s net sales represented 31% of our consolidated net sales, compared to 31% in 2012, and
35% in 2011.
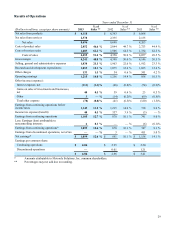
Years ended December 31 Percent Change
(Dollars in millions) 2013 2012 2011 2013—2012 2012—2011
Segment net sales $ 2,666 $ 2,709 $ 2,845 (2)% (5)%
Operating earnings 236 291 242 (19)% 20 %
Segment Results—2013 Compared to 2012
In 2013, the segment’s net sales were $2.7 billion, a 2% decrease compared to 2012. The 2% decrease in net sales in the
Enterprise segment was due to delayed spend by our customers as they continued to address a challenging macroeconomic
environment, prioritized funding for cloud and ERP maintenance, and encountered some uncertainty around operating system
roadmaps. This decline reflects a decrease in sales of: (i) iDEN, (ii) Data Capture, and (iii) WLAN, partially offset by an
increase in Enterprise Mobile Computing sales due to the Psion acquisition. The decrease in net sales for the segment reflects a
decline in North America and Latin America, offset by an increase in EA and APME, compared to 2012. The decline in North
America was driven by lower sales in the Data Capture and WLAN product groups, while the decline in Latin America was
driven by the anticipated decline in iDEN. The increases in EA and APME were primarily driven by Enterprise Mobile
Computing sales, with EA net sales increasing due to the Psion acquisition. Data Capture and WLAN product groups grew in
the fourth quarter of 2013 as compared to the fourth quarter of 2012 as we saw an increase in customer spending. Net sales in
North America continued to comprise a significant portion of the segment’s business, accounting for approximately 44% of the
segment’s net sales in 2013, and approximately 47% in 2012. The segment’s backlog was $833 million at December 31, 2013,
compared to $782 million at December 31, 2012.
The segment had operating earnings of $236 million in 2013, compared to operating earnings of $291 million in 2012.
As a percentage of net sales in 2013 as compared to 2012, gross margin was 2% lower, SG&A expenditures decreased, and
R&D expenditures decreased. The decrease in operating earnings was primarily due to: (i) a decline in gross margin primarily
attributable to the anticipated decline in iDEN sales, which typically have higher margins, (ii) an increase in Psion sales with
lower margins, and (iii) an unfavorable product and service mix. The decrease in SG&A expenses was driven by a decrease in
variable compensation expenses and reduced defined benefit expenses, partially offset by incremental expenses relating to the
Psion acquisition.
Segment Results—2012 Compared to 2011
In 2012, the segment’s net sales were $2.7 billion, a 5% decrease compared to net sales of $2.8 billion in 2011. The 5%
decrease in net sales in the Enterprise segment reflects a decrease in sales of: (i) iDEN, (ii) Enterprise Mobile Computing, and
(iii) WLAN, partially offset by an increase in Data Capture equipment sales. The decrease in net sales for the segment reflects a
decline in North America, Latin America, and EA, and an increase in APME. Net sales in North America continued to comprise
a significant portion of the segment’s business, accounting for approximately 47% of the segment’s net sales in 2012, and
approximately 46% in 2011. The segment’s backlog was $782 million at December 31, 2012, compared to $875 million at
December 31, 2011. The decline in backlog is primarily related to the anticipated decline in iDEN and reduced information
technology spending driven by macroeconomic uncertainty.
The segment had operating earnings of $291 million in 2012, compared to operating earnings of $242 million in 2011.
The increase in operating earnings was primarily due to a decrease in Other charges as a result of a reduction in intangibles
amortization as certain intangible assets are fully amortized, as well as a decline from net legal matters that occurred in 2011.
The decrease in Other charges was partially offset by: (i) a decrease in gross margin, primarily attributable to a decline in
volume, and unfavorable foreign currency fluctuations, (ii) increased SG&A expenses due to increases in pension and
employee benefit related expenses and the acquisition of Psion, and (iii) an increase in R&D expenditures, driven by higher
employee benefit expenses and increased investment in next-generation technologies, including the acquisition of Psion. As a
percentage of net sales in 2012 as compared to 2011, gross margin decreased primarily related to unfavorable foreign currency
fluctuations and product mix, and operating leverage decreased due to the 5% decline in net sales.
Reorganization of Businesses