Motorola 2013 Annual Report Download - page 58
Download and view the complete annual report
Please find page 58 of the 2013 Motorola annual report below. You can navigate through the pages in the report by either clicking on the pages listed below, or by using the keyword search tool below to find specific information within the annual report.-
 1
1 -
2
-
3
-
4
-
5
-
6
-
7
-
8
-
9
-
10
-
11
-
12
-
13
-
14
-
15
-
16
-
17
-
18
-
19
-
20
-
21
-
22
-
23
-
24
-
25
-
26
-
27
-
28
-
29
-
30
-
31
-
32
-
33
-
34
-
35
-
36
-
37
-
38
-
39
-
40
-
41
-
42
-
43
-
44
-
45
-
46
-
47
-
 48
48 -
 49
49 -
 50
50 -
 51
51 -
 52
52 -
 53
53 -
 54
54 -
 55
55 -
 56
56 -
 57
57 -
 58
58 -
 59
59 -
 60
60 -
 61
61 -
 62
62 -
 63
63 -
 64
64 -
 65
65 -
 66
66 -
 67
67 -
 68
68 -
69
-
70
-
71
-
72
-
73
-
74
-
75
-
76
-
77
-
78
-
79
-
80
-
81
-
82
-
83
-
84
-
85
-
86
-
87
-
88
-
89
-
90
-
91
-
92
-
93
-
94
-
95
-
96
-
97
-
98
-
99
-
100
-
101
-
102
-
103
-
104
-
105
-
106
-
107
-
108
-
109
-
110
-
111
 |
 |

56
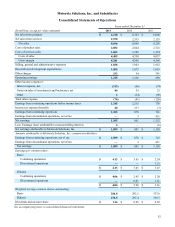
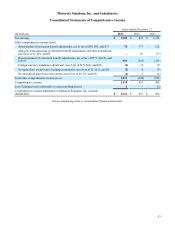
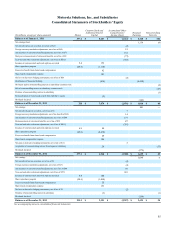
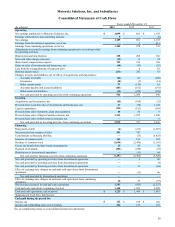
Motorola Solutions, Inc. and Subsidiaries
Consolidated Statements of Cash Flows
Years ended December 31
(In millions) 2013 2012 2011
Operating
Net earnings attributable to Motorola Solutions, Inc. $ 1,099 $ 881 $ 1,158
Earnings attributable to noncontrolling interests 6— (6)
Net earnings 1,105 881 1,152
Earnings from discontinued operations, net of tax —3 411
Earnings from continuing operations, net of tax 1,105 878 741
Adjustments to reconcile earnings from continuing operations to net cash provided
by operating activities:
Depreciation and amortization 228 208 366
Non-cash other charges (income) (12) 11 34
Share-based compensation expense 153 184 168
Gains on sales of investments and businesses, net (40) (39) (23)
Loss from the extinguishment of long term debt —6 81
Deferred income taxes (231) 242 63
Changes in assets and liabilities, net of effects of acquisitions and dispositions:
Accounts receivable (66) 81 (250)
Inventories (10) (3) (14)
Other current assets 51 (118) 61
Accounts payable and accrued liabilities (201) (162) (191)
Other assets and liabilities (33) (220) (188)
Net cash provided by operating activities from continuing operations 944 1,068 848
Investing
Acquisitions and investments, net (65) (109) (32)
Proceeds from (used for) sales of investments and businesses, net 67 (38) 1,124
Capital expenditures (191) (187) (186)
Proceeds from sales of property, plant and equipment 66 56 6
Proceeds from sales of Sigma Fund investments, net 2,133 1,075 1,508
Proceeds from sales of short-term investments, net —— 6
Net cash provided by investing activities from continuing operations 2,010 797 2,426
Financing
Repayment of debt (4) (413) (1,219)
Net proceeds from issuance of debt 593 747 —
Contributions to Motorola Mobility —(73) (3,425)
Issuance of common stock 165 133 192
Purchase of common stock (1,694) (2,438) (1,110)
Excess tax benefit from share-based compensation 25 20 42
Payment of dividends (292) (270) (72)
Distributions to discontinued operations —(11) 64
Net cash used for financing activities from continuing operations (1,207) (2,305) (5,528)
Net cash provided by operating activities from discontinued operations —2 26
Net cash provided by investing activities from discontinued operations —— (8)
Net cash provided by financing activities from discontinued operations —11 (64)
Effect of exchange rate changes on cash and cash equivalents from discontinued
operations —(13) 46
Net cash provided by discontinued operations —— —
Effect of exchange rate changes on cash and cash equivalents from continuing
operations 10 27 (73)
Net increase (decrease) in cash and cash equivalents 1,757 (413) (2,327)
Cash and cash equivalents, beginning of period 1,468 1,881 4,208
Cash and cash equivalents, end of period $ 3,225 $ 1,468 $ 1,881
Supplemental Cash Flow Information
Cash paid during the period for:
Interest, net $ 122 $ 109 $ 166
Income and withholding taxes, net of refunds 246 127 107
See accompanying notes to consolidated financial statements.