Motorola 2013 Annual Report Download - page 27
Download and view the complete annual report
Please find page 27 of the 2013 Motorola annual report below. You can navigate through the pages in the report by either clicking on the pages listed below, or by using the keyword search tool below to find specific information within the annual report.-
 1
1 -
2
-
3
-
4
-
5
-
6
-
7
-
8
-
9
-
10
-
11
-
12
-
13
-
14
-
15
-
16
-
 17
17 -
 18
18 -
 19
19 -
 20
20 -
 21
21 -
 22
22 -
 23
23 -
 24
24 -
 25
25 -
 26
26 -
 27
27 -
 28
28 -
 29
29 -
 30
30 -
 31
31 -
 32
32 -
 33
33 -
 34
34 -
 35
35 -
 36
36 -
 37
37 -
38
-
39
-
40
-
41
-
42
-
43
-
44
-
45
-
46
-
47
-
48
-
49
-
50
-
51
-
52
-
53
-
54
-
55
-
56
-
57
-
58
-
59
-
60
-
61
-
62
-
63
-
64
-
65
-
66
-
67
-
68
-
69
-
70
-
71
-
72
-
73
-
74
-
75
-
76
-
77
-
78
-
79
-
80
-
81
-
82
-
83
-
84
-
85
-
86
-
87
-
88
-
89
-
90
-
91
-
92
-
93
-
94
-
95
-
96
-
97
-
98
-
99
-
100
-
101
-
102
-
103
-
104
-
105
-
106
-
107
-
108
-
109
-
110
-
111
 |
 |
25
Item 6: Selected Financial Data
Motorola Solutions, Inc. and Subsidiaries
Five-Year Financial Summary
Years Ended December 31
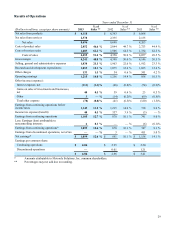
(In millions, except per share amounts) 2013 2012 2011 2010 2009
Operating Results
Net sales from products $ 6,118 $ 6,363 $ 6,068 $ 5,616 $ 5,026
Net sales from services 2,578 2,335 2,135 2,001 1,921
Net sales 8,696 8,698 8,203 7,617 6,947
Costs of product sales 2,852 2,844 2,723 2,523 2,221
Costs of services sales 1,603 1,506 1,334 1,282 1,249
Costs of sales 4,455 4,350 4,057 3,805 3,470
Gross margin 4,241 4,348 4,146 3,812 3,477
Selling, general and administrative expenses 1,838 1,963 1,912 1,874 1,662
Research and development expenditures 1,055 1,075 1,035 1,037 993
Other charges 133 54 341 150 255
Operating earnings 1,215 1,256 858 751 567
Other income (expense):
Interest expense, net (113) (66) (74) (129) (133)
Gains on sales of investments and businesses, net 40 39 23 49 108
Other 3(14) (69) (7) 91
Total other income (expense) (70) (41) (120) (87) 66
Earnings from continuing operations before income taxes 1,145 1,215 738 664 633
Income tax expense (benefit) 40 337 (3) 403 188
Earnings from continuing operations 1,105 878 741 261 445
Earnings (loss) from discontinued operations, net of tax —3 411 389 (473)
Net earnings (loss) 1,105 881 1,152 650 (28)
Less: Earnings (loss) attributable to noncontrolling
interests 6— (6) 17 23
Net earnings (loss) attributable to Motorola Solutions,
Inc. $ 1,099 $ 881 $ 1,158 $ 633 $ (51)
Amounts attributable to Motorola Solutions, Inc. common
stockholders:
Earnings from continuing operations, net of tax $ 1,099 $ 878 $ 747 $ 244 $ 422
Earnings (loss) from discontinued operations, net of tax —3 411 389 (473)
Net earnings (loss) $ 1,099 $ 881 $ 1,158 $ 633 $ (51)
Per Share Data (in dollars)
Diluted earnings from continuing operations per
common share $ 4.06 $ 2.95 $ 2.20 $ 0.72 $ 1.28
Diluted earnings (loss) per common share 4.06 2.96 3.41 1.87 (0.15)
Diluted weighted average common shares outstanding
(in millions) 270.5 297.4 339.7 338.1 329.9
Dividends declared per share $ 1.14 $ 0.96 $ 0.22 $ — $ —
Balance Sheet
Total assets $ 11,851 $ 12,679 $ 13,929 $ 25,577 $ 25,603
Long-term debt 2,457 1,859 1,130 2,098 3,258
Total debt 2,461 1,863 1,535 2,703 3,794
Total stockholders’ equity 3,689 3,290 5,274 10,987 9,883
Other Data
Capital expenditures $ 191 $ 187 $ 186 $ 192 $ 136
% of sales 2.2% 2.1% 2.3% 2.5% 2.0%
Research and development expenditures $ 1,055 $ 1,075 $ 1,035 $ 1,037 $ 993
% of sales 12.1% 12.4% 12.6% 13.6% 14.3%
Year-end employment (in thousands) 21 22 23 51 53