Motorola 2013 Annual Report Download - page 84
Download and view the complete annual report
Please find page 84 of the 2013 Motorola annual report below. You can navigate through the pages in the report by either clicking on the pages listed below, or by using the keyword search tool below to find specific information within the annual report.-
 1
1 -
2
-
3
-
4
-
5
-
6
-
7
-
8
-
9
-
10
-
11
-
12
-
13
-
14
-
15
-
16
-
17
-
18
-
19
-
20
-
21
-
22
-
23
-
24
-
25
-
26
-
27
-
28
-
29
-
30
-
31
-
32
-
33
-
34
-
35
-
36
-
37
-
38
-
39
-
40
-
41
-
42
-
43
-
44
-
45
-
46
-
47
-
48
-
49
-
50
-
51
-
52
-
53
-
54
-
55
-
56
-
57
-
58
-
59
-
60
-
61
-
62
-
63
-
64
-
65
-
66
-
67
-
68
-
69
-
70
-
71
-
72
-
73
-
 74
74 -
 75
75 -
 76
76 -
 77
77 -
 78
78 -
 79
79 -
 80
80 -
 81
81 -
 82
82 -
 83
83 -
 84
84 -
 85
85 -
 86
86 -
 87
87 -
 88
88 -
 89
89 -
 90
90 -
 91
91 -
 92
92 -
 93
93 -
 94
94 -
95
-
96
-
97
-
98
-
99
-
100
-
101
-
102
-
103
-
104
-
105
-
106
-
107
-
108
-
109
-
110
-
111
 |
 |
82
actively traded options on the Company’s stock and the Company’s assessment that implied volatility is more representative of
future stock price trends than historical volatility.
The risk-free interest rate assumption is based upon the average daily closing rates during the year for U.S. Treasury
notes that have a life which approximates the expected life of the option. The dividend yield assumption is based on the
Company’s future expectation of dividend payouts. The expected life of employee stock options represents the average of the
contractual term of the options and the weighted-average vesting period for all option tranches.
The Company has applied forfeiture rates, estimated based on historical data, of 10%-50% to the option fair values
calculated by the Black-Scholes option pricing model. These estimated forfeiture rates are applied to grants based on their
remaining vesting term and may be revised in subsequent periods if actual forfeitures differ from these estimates.
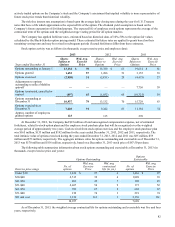
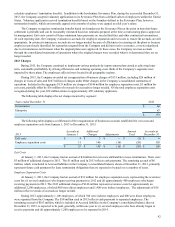
Stock option activity was as follows (in thousands, except exercise price and employee data):
2013 2012 2011
Years ended December 31
Shares
Subject to
Options
Wtd. Avg.
Exercise
Price
Shares
Subject to
Options
Wtd. Avg.
Exercise
Price
Shares
Subject to
Options
Wtd. Avg.
Exercise
Price
Options outstanding at January 1 13,132 $ 70 15,729 $ 63 19,614 $ 81
Options granted 1,652 57 1,286 51 3,155 39
Options exercised (2,950) 31 (2,831) 29 (4,475) 27
Adjustments to options
outstanding to reflect Mobility
spin-off — — — — 7,756 39
Options terminated, cancelled or
expired (897) 65 (1,052) 60 (10,321) 59
Options outstanding at
December 31 10,937 79 13,132 70 15,729 63
Options exercisable at
December 31 7,628 91 9,242 81 11,184 74
Approx. number of employees
granted options 123 115 270
At December 31, 2013, the Company had $23 million of total unrecognized compensation expense, net of estimated
forfeitures, related to stock option plans and the employee stock purchase plan that will be recognized over the weighted
average period of approximately two years. Cash received from stock option exercises and the employee stock purchase plan
was $165 million, $133 million and $192 million for the years ended December 31, 2013, 2012 and 2011, respectively. The
total intrinsic value of options exercised during the years ended December 31, 2013, 2012 and 2011 was $85 million, $59
million and $73 million, respectively. The aggregate intrinsic value for options outstanding and exercisable as of December 31,
2013 was $170 million and $116 million, respectively, based on a December 31, 2013 stock price of $67.50 per share.
The following table summarizes information about stock options outstanding and exercisable at December 31, 2013 (in
thousands, except exercise price and years):
Options Outstanding Options
Exercisable
Exercise price range No. of
options
Wtd. avg.
Exercise
Price
Wtd. avg.
contractual
life (in yrs.) No. of
options
Wtd. avg.
Exercise
Price
Under $30 1,416 $ 27 6 1,416 $ 27
$30-$40 2,515 39 6 1,828 39
$41-$50 401 45 7 188 45
$51-$60 2,467 54 9 173 52
$61-$70 783 67 2 668 67
$71-$80 219 74 3 219 74
$81 and over 3,136 161 1 3,136 161
10,937 7,628
As of December 31, 2013, the weighted average contractual life for options outstanding and exercisable was five and four
years, respectively.