Motorola 2013 Annual Report Download - page 35
Download and view the complete annual report
Please find page 35 of the 2013 Motorola annual report below. You can navigate through the pages in the report by either clicking on the pages listed below, or by using the keyword search tool below to find specific information within the annual report.-
 1
1 -
2
-
3
-
4
-
5
-
6
-
7
-
8
-
9
-
10
-
11
-
12
-
13
-
14
-
15
-
16
-
17
-
18
-
19
-
20
-
21
-
22
-
23
-
24
-
 25
25 -
 26
26 -
 27
27 -
 28
28 -
 29
29 -
 30
30 -
 31
31 -
 32
32 -
 33
33 -
 34
34 -
 35
35 -
 36
36 -
 37
37 -
 38
38 -
 39
39 -
 40
40 -
 41
41 -
 42
42 -
 43
43 -
 44
44 -
 45
45 -
46
-
47
-
48
-
49
-
50
-
51
-
52
-
53
-
54
-
55
-
56
-
57
-
58
-
59
-
60
-
61
-
62
-
63
-
64
-
65
-
66
-
67
-
68
-
69
-
70
-
71
-
72
-
73
-
74
-
75
-
76
-
77
-
78
-
79
-
80
-
81
-
82
-
83
-
84
-
85
-
86
-
87
-
88
-
89
-
90
-
91
-
92
-
93
-
94
-
95
-
96
-
97
-
98
-
99
-
100
-
101
-
102
-
103
-
104
-
105
-
106
-
107
-
108
-
109
-
110
-
111
 |
 |

33
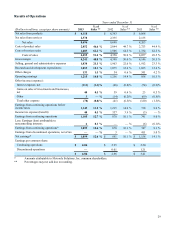
Earnings from Continuing Operations
After taxes, and excluding earnings attributable to noncontrolling interests, we had net earnings from continuing operations
of $878 million, or $2.95 per diluted share, in 2012, compared to $747 million, or $2.20 per diluted share, in 2011. The increase
in earnings from continuing operations in 2012 compared to 2011 was primarily attributable to: (i) $287 million decrease in
other charges related to lower intangible asset amortization, (ii) net income from legal matters of $16 million compared to
charges of $88 million, and (iii) $202 million increase in gross margin, partially offset by the $274 million benefit for the
valuation allowance reversal recorded during 2011. The increase in earnings per diluted share was primarily due to the increase
in earnings from continuing operations and the reduction in shares outstanding as a result of our share repurchase program.
Earnings from Discontinued Operations
After taxes, we had earnings from discontinued operations of $3 million, or $0.01 per diluted share, in 2012, compared to
earnings from discontinued operations of $411 million, or $1.21 per diluted share, in 2011. The earnings from discontinued
operations in 2011 were primarily from the operations of and the gain on the sale of the Networks business.
Segment Information
The following commentary should be read in conjunction with the financial results of each operating business segment as
detailed in Note 12, “Information by Segment and Geographic Region,” to our consolidated financial statements. Net sales and
operating results for our two segments for 2013, 2012, and 2011 are presented below.
Government Segment
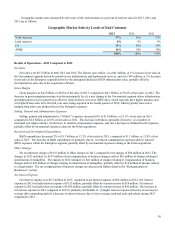
In 2013, the Government segment’s net sales represented 69% of our consolidated net sales, compared to 69% in 2012, and
65% in 2011.
Years ended December 31 Percent Change
(Dollars in millions) 2013 2012 2011 2013—2012 2012—2011
Segment net sales $ 6,030 $ 5,989 $ 5,358 1% 12%
Operating earnings 979 965 616 1% 57%
Segment Results—2013 Compared to 2012
In 2013, the segment’s net sales were $6.0 billion, a 1% increase compared to 2012. The 1% increase in net sales in the
Government segment primarily reflects an increase in sales of infrastructure and deployment services. On a geographic basis,
net sales declined in APME, were flat in North America and Latin America, and increased in EA, compared to 2012. Net sales
in North America continued to comprise a significant portion of the segment’s business, accounting for approximately 64% of
the segment’s net sales in 2013 and approximately 63% in 2012. North America showed continued strength in sales to state
and local governments; however, federal sales declined partially due to sequestration and the government shutdown in October
2013. EA showed strong growth driven by infrastructure and deployment services. Our sales of PCR declined coming off of a
record sales year in 2012. The segment’s backlog was $5.4 billion at December 31, 2013 and $4.9 billion at December 31,
2012.
The segment had operating earnings of $979 million in 2013, compared to operating earnings of $965 million in 2012.
As a percentage of net sales in 2013 as compared to 2012, gross margin was down 1%, SG&A expenditures decreased, and
R&D expenditures decreased. The increase in operating earnings was primarily due to a decrease in SG&A expenses, driven
by a decrease in variable compensation expenses and reduced defined benefit plan expenses, partially offset by a mix change
where infrastructure and deployment services growth was offset by radio declines.
Segment Results—2012 Compared to 2011
In 2012, the segment’s net sales were $6.0 billion, a 12% increase compared to net sales of $5.4 billion in 2011. The 12%
increase in net sales in the Government segment reflects broad based growth across the portfolio and in all regions. Net sales in
North America continued to comprise a significant portion of the segment’s business, accounting for approximately 63% of the
segment’s net sales in both 2012 and 2011. The segment’s backlog was $4.9 billion at December 31, 2012 and $4.4 billion at
December 31, 2011.
The segment had operating earnings of $965 million in 2012, compared to operating earnings of $616 million in 2011.
The increase in operating earnings was primarily due to: (i) an increase in gross margin, driven by the 12% increase in net sales
and (ii) a decline in Other charges, driven by net income from legal matters that occurred in 2011, partially offset by an increase
in SG&A expenses and R&D expenditures. The increase in SG&A expenses was due to increases in pension and employee
benefit related expenses, and the increase in R&D expenditures was driven by higher employee benefit related expenses and