Motorola 2013 Annual Report Download - page 86
Download and view the complete annual report
Please find page 86 of the 2013 Motorola annual report below. You can navigate through the pages in the report by either clicking on the pages listed below, or by using the keyword search tool below to find specific information within the annual report.-
 1
1 -
2
-
3
-
4
-
5
-
6
-
7
-
8
-
9
-
10
-
11
-
12
-
13
-
14
-
15
-
16
-
17
-
18
-
19
-
20
-
21
-
22
-
23
-
24
-
25
-
26
-
27
-
28
-
29
-
30
-
31
-
32
-
33
-
34
-
35
-
36
-
37
-
38
-
39
-
40
-
41
-
42
-
43
-
44
-
45
-
46
-
47
-
48
-
49
-
50
-
51
-
52
-
53
-
54
-
55
-
56
-
57
-
58
-
59
-
60
-
61
-
62
-
63
-
64
-
65
-
66
-
67
-
68
-
69
-
70
-
71
-
72
-
73
-
74
-
75
-
 76
76 -
 77
77 -
 78
78 -
 79
79 -
 80
80 -
 81
81 -
 82
82 -
 83
83 -
 84
84 -
 85
85 -
 86
86 -
 87
87 -
 88
88 -
 89
89 -
 90
90 -
 91
91 -
 92
92 -
 93
93 -
 94
94 -
 95
95 -
 96
96 -
97
-
98
-
99
-
100
-
101
-
102
-
103
-
104
-
105
-
106
-
107
-
108
-
109
-
110
-
111
 |
 |

84
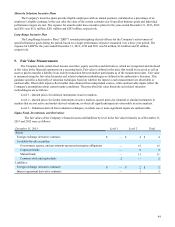
Motorola Solutions Incentive Plans
The Company's incentive plans provide eligible employees with an annual payment, calculated as a percentage of an
employee’s eligible earnings, in the year after the close of the current calendar year if specified business goals and individual
performance targets are met. The expense for awards under these incentive plans for the years ended December 31, 2013, 2012
and 2011 was $121 million, $201 million and $203 million, respectively.
Long-Range Incentive Plan
The Long-Range Incentive Plan (“LRIP”) rewards participating elected officers for the Company’s achievement of
specified business goals during the period, based on a single performance objective measured over a three year period. The
expense for LRIP for the years ended December 31, 2013, 2012 and 2011 was $6 million, $12 million and $3 million,
respectively.
9. Fair Value Measurements
The Company holds certain fixed income securities, equity securities and derivatives, which are recognized and disclosed
at fair value in the financial statements on a recurring basis. Fair value is defined as the price that would be received to sell an
asset or paid to transfer a liability in an orderly transaction between market participants as of the measurement date. Fair value
is measured using the fair value hierarchy and related valuation methodologies as defined in the authoritative literature. This
guidance specifies a hierarchy of valuation techniques based on whether the inputs to each measurement are observable or
unobservable. Observable inputs reflect market data obtained from independent sources, while unobservable inputs reflect the
Company's assumptions about current market conditions. The prescribed fair value hierarchy and related valuation
methodologies are as follows:
Level 1 - Quoted prices for identical instruments in active markets.
Level 2 - Quoted prices for similar instruments in active markets, quoted prices for identical or similar instruments in
markets that are not active and model-derived valuations, in which all significant inputs are observable in active markets.
Level 3 - Valuations derived from valuation techniques, in which one or more significant inputs are unobservable.
Sigma Fund, Investments, and Derivatives
The fair values of the Company’s financial assets and liabilities by level in the fair value hierarchy as of December 31,
2013 and 2012 were as follows:
December 31, 2013 Level 1 Level 2 Total
Assets:
Foreign exchange derivative contracts $ — $ 4 $ 4
Available-for-sale securities:
Government, agency, and government-sponsored enterprise obligations — 15 15
Corporate bonds —99
Mutual funds — 11 11
Common stock and equivalents 2 — 2
Liabilities:
Foreign exchange derivative contracts $ — $ 2 $ 2
Interest agreement derivative contracts —33