Motorola 2013 Annual Report Download - page 32
Download and view the complete annual report
Please find page 32 of the 2013 Motorola annual report below. You can navigate through the pages in the report by either clicking on the pages listed below, or by using the keyword search tool below to find specific information within the annual report.-
 1
1 -
2
-
3
-
4
-
5
-
6
-
7
-
8
-
9
-
10
-
11
-
12
-
13
-
14
-
15
-
16
-
17
-
18
-
19
-
20
-
21
-
 22
22 -
 23
23 -
 24
24 -
 25
25 -
 26
26 -
 27
27 -
 28
28 -
 29
29 -
 30
30 -
 31
31 -
 32
32 -
 33
33 -
 34
34 -
 35
35 -
 36
36 -
 37
37 -
 38
38 -
 39
39 -
 40
40 -
 41
41 -
 42
42 -
43
-
44
-
45
-
46
-
47
-
48
-
49
-
50
-
51
-
52
-
53
-
54
-
55
-
56
-
57
-
58
-
59
-
60
-
61
-
62
-
63
-
64
-
65
-
66
-
67
-
68
-
69
-
70
-
71
-
72
-
73
-
74
-
75
-
76
-
77
-
78
-
79
-
80
-
81
-
82
-
83
-
84
-
85
-
86
-
87
-
88
-
89
-
90
-
91
-
92
-
93
-
94
-
95
-
96
-
97
-
98
-
99
-
100
-
101
-
102
-
103
-
104
-
105
-
106
-
107
-
108
-
109
-
110
-
111
 |
 |

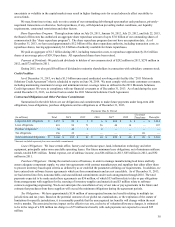
30
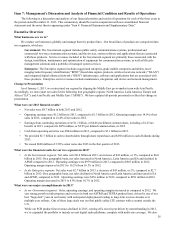
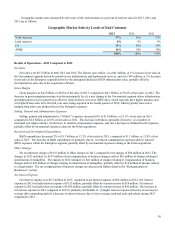
Geographic market sales measured by the locale of the end customer as a percent of total net sales for 2013, 2012 and
2011 are as follows:
Geographic Market Sales by Locale of End Customer
2013 2012 2011
North America 57% 58% 57%
Latin America 8% 8% 9%
EA 21% 20% 20%
APME 14% 14% 14%
100% 100% 100%
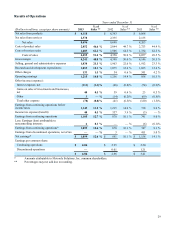
Results of Operations—2013 Compared to 2012
Net Sales
Net sales were $8.7 billion in both 2013 and 2012. The flat net sales reflect: (i) a $41 million, or 1% increase in net sales in
the Government segment driven by growth in our infrastructure and deployment services, and (ii) a $43 million, or 2% decrease
in net sales in the Enterprise segment driven by the anticipated decline in iDEN infrastructure sales, partially offset by
incremental net sales due to the acquisition of Psion.
Gross Margin
Gross margin was $4.2 billion, or 48.8% of net sales in 2013, compared to $4.3 billion, or 50.0% of net sales, in 2012. The
decrease in gross margin percentage was driven primarily by: (i) a mix change in the Government segment where infrastructure
and deployment services growth was offset by radio declines, (ii) lower iDEN sales, which typically have higher margins, and
(iii) higher Psion sales in its first full year since being acquired in the fourth quarter of 2012, which typically have lower
margins than other core product lines in the Enterprise segment.
Selling, General and Administrative Expenses
Selling, general and administrative (“SG&A”) expenses decreased 6% to $1.8 billion, or 21.1% of net sales in 2013,
compared to $2.0 billion, or 22.6% of net sales in 2012. The decrease in SG&A is primarily driven by: (i) a number of
structural cost improvements, (ii) decrease in variable compensation expenses, and (iii) a decrease in defined benefit expenses,
partially offset by incremental expenses related to the Psion acquisition.
Research and Development Expenditures
R&D expenditures decreased 2% to $1.1 billion, or 12.1% of net sales in 2013, compared to $1.1 billion, or 12.4% of net
sales in 2012. The decrease in R&D expenditures is primarily due to: (i) reduced compensation expenses and (ii) reduced
iDEN expenses within the Enterprise segment, partially offset by incremental expenses relating to the Psion acquisition.
Other Charges
We recorded net charges of $133 million in Other charges in 2013, compared to net charges of $54 million in 2012. The
charges in 2013 included: (i) $107 million of net reorganization of business charges and (ii) $26 million of charges relating to
amortization of intangibles. The charges in 2012 included: (i) $41 million of charges relating to reorganization of business
charges and (ii) $29 million of charges relating to amortization of intangibles, partially offset by $16 million of income related
to a legal matter. The net reorganization of business charges are discussed in further detail in the “Reorganization of
Businesses” section.
Net Interest Expense
Net interest expense was $113 million in 2013, compared to net interest expense of $66 million in 2012. Net interest
expense in 2013 included interest expense of $132 million, partially offset by interest income of $19 million. Net interest
expense in 2012 included interest expense of $108 million, partially offset by interest income of $42 million. The increase in
net interest expense in 2013 compared to 2012 is primarily attributable to: (i) higher interest expense driven by an increase in
average debt outstanding and (ii) a decrease in interest income due to lower average cash and cash equivalents during 2013
compared to 2012.