Motorola 2013 Annual Report Download - page 28
Download and view the complete annual report
Please find page 28 of the 2013 Motorola annual report below. You can navigate through the pages in the report by either clicking on the pages listed below, or by using the keyword search tool below to find specific information within the annual report.-
 1
1 -
2
-
3
-
4
-
5
-
6
-
7
-
8
-
9
-
10
-
11
-
12
-
13
-
14
-
15
-
16
-
17
-
 18
18 -
 19
19 -
 20
20 -
 21
21 -
 22
22 -
 23
23 -
 24
24 -
 25
25 -
 26
26 -
 27
27 -
 28
28 -
 29
29 -
 30
30 -
 31
31 -
 32
32 -
 33
33 -
 34
34 -
 35
35 -
 36
36 -
 37
37 -
 38
38 -
39
-
40
-
41
-
42
-
43
-
44
-
45
-
46
-
47
-
48
-
49
-
50
-
51
-
52
-
53
-
54
-
55
-
56
-
57
-
58
-
59
-
60
-
61
-
62
-
63
-
64
-
65
-
66
-
67
-
68
-
69
-
70
-
71
-
72
-
73
-
74
-
75
-
76
-
77
-
78
-
79
-
80
-
81
-
82
-
83
-
84
-
85
-
86
-
87
-
88
-
89
-
90
-
91
-
92
-
93
-
94
-
95
-
96
-
97
-
98
-
99
-
100
-
101
-
102
-
103
-
104
-
105
-
106
-
107
-
108
-
109
-
110
-
111
 |
 |
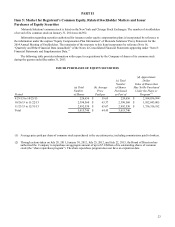
26
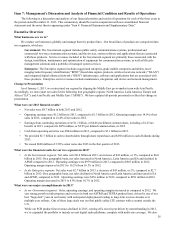
Item 7: Management’s Discussion and Analysis of Financial Condition and Results of Operations
The following is a discussion and analysis of our financial position and results of operations for each of the three years in
the period ended December 31, 2013. This commentary should be read in conjunction with our consolidated financial
statements and the notes thereto appearing under “Item 8: Financial Statements and Supplementary Data.”
Executive Overview
What businesses are we in?
We conduct our businesses globally and manage them by product lines. Our broad lines of products are categorized into
two segments, which are:
Government: The Government segment includes public safety communications systems, professional and
commercial two-way communication systems, and the devices, system software and applications that are associated
with these products. Service revenues included in the Government segment are primarily those associated with the
design, installation, maintenance and optimization of equipment for communication systems, as well as lifecycle
management solutions and a portfolio of managed system services.
Enterprise: The Enterprise segment includes rugged and enterprise-grade mobile computers and tablets, laser/
imaging/radio frequency identification (“RFID”) based data capture products, wireless local area network (“WLAN”)
and integrated digital enhanced network (“iDEN”) infrastructure, software and applications that are associated with
these products. Enterprise service revenues include maintenance, integration, and device and network management.
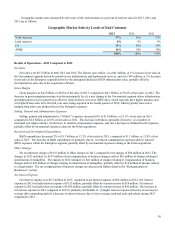
Change in Presentation
As of January 1, 2013, we restructured our regions by aligning the Middle East go-to-market team with Asia Pacific.
Accordingly, we now report net sales for the following four geographic regions: North America; Latin America; Europe and
Africa ("EA"); and Asia Pacific and Middle East ("APME"). We have updated all periods presented to reflect this change in
presentation.
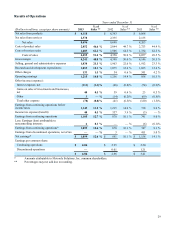
What were our 2013 financial results?
• Net sales were $8.7 billion in both 2013 and 2012.
• Operating earnings were $1.2 billion in 2013, compared to $1.3 billion in 2012. Operating margin was 14.0% of net
sales in 2013, compared to 14.4% of net sales in 2012.
• Earnings from continuing operations were $1.1 billion, or $4.06 per diluted common share, including a $1.25 tax
benefit, in 2013, compared to $878 million, or $2.95 per diluted common share, in 2012.
• Cash from operating activities was $944 million in 2013, compared to $1.1 billion in 2012.
• We provided $1.7 billion in cash to shareholders through share repurchases and $292 million in cash dividends during
2013.
• We issued $600 million of 3.50% senior notes due 2023 in the first quarter of 2013.
What were the financial results for our two segments in 2013?
• In the Government segment: Net sales were $6.0 billion in 2013, an increase of $41 million, or 1%, compared to $6.0
billion in 2012. On a geographic basis, net sales increased in North America, Latin America and EA and declined in
APME compared to 2012. Operating earnings were $979 million in 2013, compared to $965 million in 2012.
Operating margin improved in 2013 to 16.2% from 16.1% in 2012.
• In the Enterprise segment: Net sales were $2.7 billion in 2013, a decrease of $43 million, or 2%, compared to $2.7
billion in 2012. On a geographic basis, net sales declined in North America and Latin America and increased in EA
and APME, compared to 2012. Operating earnings were $236 million in 2013, compared to $291 million in 2012.
Operating margin decreased in 2013 to 8.9% from 10.7% in 2012.
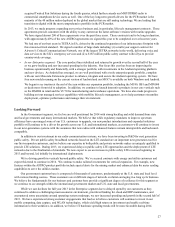
What were our major accomplishments in 2013?
• In our Government segment: Sales, operating earnings, and operating margins increased as compared to 2012. We
saw strong growth in infrastructure and services in both our ASTRO and TETRA product lines, driven by one of our
best “large deal” years in our history with anticipated deployments leading to long-term revenue streams over
multiple-year rollouts. One of these large deals was our first public safety LTE contract with a country outside the
U.S.
While our PCR product line revenues declined in 2013, coming off a record year driven by narrowbanding in 2012,
we’ve expanded the portfolio to include several digital radio platforms, complete with multi-site coverage. We also