Motorola 2013 Annual Report Download - page 68
Download and view the complete annual report
Please find page 68 of the 2013 Motorola annual report below. You can navigate through the pages in the report by either clicking on the pages listed below, or by using the keyword search tool below to find specific information within the annual report.-
 1
1 -
2
-
3
-
4
-
5
-
6
-
7
-
8
-
9
-
10
-
11
-
12
-
13
-
14
-
15
-
16
-
17
-
18
-
19
-
20
-
21
-
22
-
23
-
24
-
25
-
26
-
27
-
28
-
29
-
30
-
31
-
32
-
33
-
34
-
35
-
36
-
37
-
38
-
39
-
40
-
41
-
42
-
43
-
44
-
45
-
46
-
47
-
48
-
49
-
50
-
51
-
52
-
53
-
54
-
55
-
56
-
57
-
 58
58 -
 59
59 -
 60
60 -
 61
61 -
 62
62 -
 63
63 -
 64
64 -
 65
65 -
 66
66 -
 67
67 -
 68
68 -
 69
69 -
 70
70 -
 71
71 -
 72
72 -
 73
73 -
 74
74 -
 75
75 -
 76
76 -
 77
77 -
 78
78 -
79
-
80
-
81
-
82
-
83
-
84
-
85
-
86
-
87
-
88
-
89
-
90
-
91
-
92
-
93
-
94
-
95
-
96
-
97
-
98
-
99
-
100
-
101
-
102
-
103
-
104
-
105
-
106
-
107
-
108
-
109
-
110
-
111
 |
 |

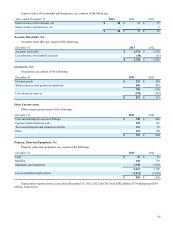
66
Gains on sales of investments and businesses, net, consists of the following:
Years ended December 31 2013 2012 2011
Gains on sales of investments, net $ 40 $ 39 $ 17
Gains on sales of businesses, net —— 6
$ 40 $ 39 $ 23
Accounts Receivable, Net
Accounts receivable, net, consist of the following:
December 31 2013 2012
Accounts receivable $ 1,976 $ 1,932
Less allowance for doubtful accounts (56)(51)
$ 1,920 $ 1,881
Inventories, Net
Inventories, net, consist of the following:
December 31 2013 2012
Finished goods $ 232 $ 244
Work-in-process and production materials 468 432
700 676
Less inventory reserves (178)(163)
$ 522 $ 513
Other Current Assets
Other current assets consist of the following:
December 31 2013 2012
Costs and earnings in excess of billings $ 390 $ 416
Contract-related deferred costs 105 141
Tax-related deposits and refunds receivable 113 95
Other 159 148
$ 767 $ 800
Property, Plant and Equipment, Net
Property, plant and equipment, net, consist of the following:
December 31 2013 2012
Land $ 36 $ 38
Building 649 739
Machinery and equipment 1,938 1,932
2,623 2,709
Less accumulated depreciation (1,813)(1,870)
$ 810 $ 839
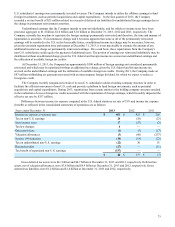
Depreciation expense for the years ended December 31, 2013, 2012 and 2011 was $202 million, $179 million and $165
million, respectively.