Microsoft 2011 Annual Report Download - page 74
Download and view the complete annual report
Please find page 74 of the 2011 Microsoft annual report below. You can navigate through the pages in the report by either clicking on the pages listed below, or by using the keyword search tool below to find specific information within the annual report.-
 1
1 -
2
-
3
-
4
-
5
-
6
-
7
-
8
-
9
-
10
-
11
-
12
-
13
-
14
-
15
-
16
-
17
-
18
-
19
-
20
-
21
-
22
-
23
-
24
-
25
-
26
-
27
-
28
-
29
-
30
-
31
-
32
-
33
-
34
-
35
-
36
-
37
-
38
-
39
-
40
-
41
-
42
-
43
-
44
-
45
-
46
-
47
-
48
-
49
-
50
-
51
-
52
-
53
-
54
-
55
-
56
-
57
-
58
-
59
-
60
-
61
-
62
-
63
-
 64
64 -
 65
65 -
 66
66 -
 67
67 -
 68
68 -
 69
69 -
 70
70 -
 71
71 -
 72
72 -
 73
73 -
 74
74 -
 75
75 -
 76
76 -
 77
77 -
 78
78 -
 79
79 -
 80
80 -
 81
81 -
 82
82 -
 83
83
 |
 |

74
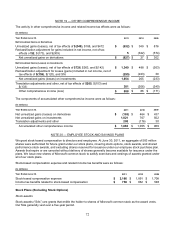
Shared Performance Stock Awards
Nonvested balance, beginning of year 30 $ 25.32
Granted 18 $ 22.56
Vested (13) $ 25.63
Forfeited (3) $ 24.05
Nonvested balance, end of year 32 $ 23.76
As of June 30, 2011, there was $4.5 billion and $467 million of total unrecognized compensation costs related to
SAs and SPSAs, respectively. These costs are expected to be recognized over a weighted average period of 3.3
years and 2.5 years, respectively.
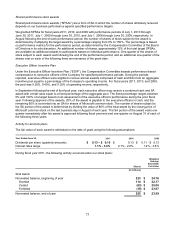
During fiscal year 2010 and 2009, the following activity occurred under our stock plans:
(In millions, except fair values) 2010 2009
Stock Awards
Awards granted 100 91
Weighted average grant-date fair value $ 23.43 $ 24.95
Shared Performance Stock Awards
Awards granted 12 10
Weighted average grant-date fair value $ 24.57 $ 25.93
Following are the fair values of stock plan awards vested during the periods reported:
(In millions)
2011 2010 2009
Total vest-date fair value of stock awards vested $ 1,521 $ 1,358 $ 1,137
Total vest-date fair value of shared performance stock awards vested $ 289
$ 227 $ 485
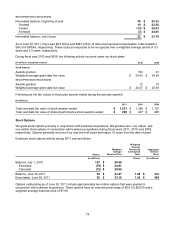
Stock Options
We grant stock options primarily in conjunction with business acquisitions. We granted zero, one million, and
one million stock options in conjunction with business acquisitions during fiscal years 2011, 2010, and 2009,
respectively. Options generally vest over four and one-half years and expire 10 years from the date of grant.
Employee stock options activity during 2011 was as follows:
Shares
Weighted
Average
Exercise Price
Weighted
Average
Remaining
Contractual
Term
Aggregate
Intrinsic
Value
(In millions) (Years) (In millions)
Balance, July 1, 2010 187 $ 24.68
Exercised (79) $ 24.91
Canceled (15) $ 28.84
Balance, June 30, 2011 93 $ 23.21 1.04 $ 312
Exercisable, June 30, 2011 92 $ 23.16 1.04 $ 309
Options outstanding as of June 30, 2011 include approximately two million options that were granted in
conjunction with business acquisitions. These options have an exercise price range of $0.01 to $29.24 and a
weighted average exercise price of $7.69.