Microsoft 2011 Annual Report Download - page 24
Download and view the complete annual report
Please find page 24 of the 2011 Microsoft annual report below. You can navigate through the pages in the report by either clicking on the pages listed below, or by using the keyword search tool below to find specific information within the annual report.-
 1
1 -
2
-
3
-
4
-
5
-
6
-
7
-
8
-
9
-
10
-
11
-
12
-
13
-
 14
14 -
 15
15 -
 16
16 -
 17
17 -
 18
18 -
 19
19 -
 20
20 -
 21
21 -
 22
22 -
 23
23 -
 24
24 -
 25
25 -
 26
26 -
 27
27 -
 28
28 -
 29
29 -
 30
30 -
 31
31 -
 32
32 -
 33
33 -
 34
34 -
35
-
36
-
37
-
38
-
39
-
40
-
41
-
42
-
43
-
44
-
45
-
46
-
47
-
48
-
49
-
50
-
51
-
52
-
53
-
54
-
55
-
56
-
57
-
58
-
59
-
60
-
61
-
62
-
63
-
64
-
65
-
66
-
67
-
68
-
69
-
70
-
71
-
72
-
73
-
74
-
75
-
76
-
77
-
78
-
79
-
80
-
81
-
82
-
83
 |
 |

24
Fiscal year 2010 compared with fiscal year 2009
OSD revenue increased reflecting increased online advertising revenue, offset in part by decreased Access (dial-
up internet) revenue. Online advertising revenue increased $146 million or 8% to $1.9 billion, reflecting higher
search and display advertising revenue, offset in part by decreased advertiser and publisher tools revenue.
Access revenue decreased $57 million or 31%, reflecting continued migration of subscribers to broadband or
other competitively-priced service providers.
OSD operating loss increased due to increased operating expenses, offset in part by increased revenue. Cost of
revenue increased $567 million, primarily driven by higher online traffic acquisition costs and Yahoo!
reimbursement and implementation costs. General and administrative expenses increased $135 million. Sales
and marketing expenses increased $51 million or 5% due mainly to increased marketing of Bing, offset in part by
decreased headcount-related expenses.
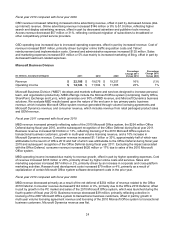
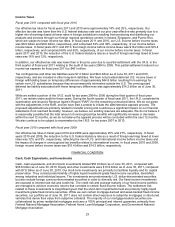
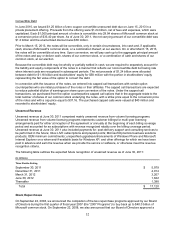
Microsoft Business Division
(In millions, except percentages) 2011 2010 2009
Percentage
Change 2011
Versus 2010
Percentage
Change 2010
Versus 2009
Revenue $ 22,186 $ 19,076 $ 19,257 16% (1)%
Operating income $ 14,124
$ 11,504 $ 11,365 23% 1%
Microsoft Business Division (“MBD”) develops and markets software and services designed to increase personal,
team, and organization productivity. MBD offerings include the Microsoft Office system (comprising mainly Office,
SharePoint, Exchange and Lync), which generates over 90% of MBD revenue, and Microsoft Dynamics business
solutions. We evaluate MBD results based upon the nature of the end user in two primary parts: business
revenue, which includes Microsoft Office system revenue generated through volume licensing agreements and
Microsoft Dynamics revenue; and consumer revenue, which includes revenue from retail packaged product sales
and OEM revenue.
Fiscal year 2011 compared with fiscal year 2010
MBD revenue increased primarily reflecting sales of the 2010 Microsoft Office system, the $254 million Office
Deferral during fiscal year 2010, and the subsequent recognition of the Office Deferral during fiscal year 2011.
Business revenue increased $2.0 billion or 13%, reflecting licensing of the 2010 Microsoft Office system to
transactional business customers, growth in multi-year volume licensing revenue, and a 10% increase in
Microsoft Dynamics revenue. Consumer revenue increased $1.1 billion or 33%, approximately half of which was
attributable to the launch of Office 2010 and half of which was attributable to the Office Deferral during fiscal year
2010 and subsequent recognition of the Office Deferral during fiscal year 2011. Excluding the impact associated
with the Office Deferral, consumer revenue increased $620 million or 17% due to sales of the 2010 Microsoft
Office system.
MBD operating income increased due mainly to revenue growth, offset in part by higher operating expenses. Cost
of revenue increased $335 million or 26%, primarily driven by higher online costs and services. Sales and
marketing expenses increased $97 million or 2%, primarily driven by an increase in corporate and cross-platform
marketing activities. Research and development costs increased $79 million or 4%, primarily as a result of
capitalization of certain Microsoft Office system software development costs in the prior year.
Fiscal year 2010 compared with fiscal year 2009
MBD revenue decreased primarily as a result of the net deferral of $254 million of revenue related to the Office
2010 Deferral. Consumer revenue decreased $142 million or 4%, primarily due to the Office 2010 Deferral, offset
in part by growth in the PC market and sales of the 2010 Microsoft Office system, which was launched during the
fourth quarter of fiscal year 2010. Business revenue decreased $39 million, primarily reflecting a decline in
licensing of the 2007 Microsoft Office system to transactional business customers, offset in part by growth in
multi-year volume licensing agreement revenue and licensing of the 2010 Microsoft Office system to transactional
business customers. Microsoft Dynamics revenue was flat.