Microsoft 2011 Annual Report Download - page 51
Download and view the complete annual report
Please find page 51 of the 2011 Microsoft annual report below. You can navigate through the pages in the report by either clicking on the pages listed below, or by using the keyword search tool below to find specific information within the annual report.-
 1
1 -
2
-
3
-
4
-
5
-
6
-
7
-
8
-
9
-
10
-
11
-
12
-
13
-
14
-
15
-
16
-
17
-
18
-
19
-
20
-
21
-
22
-
23
-
24
-
25
-
26
-
27
-
28
-
29
-
30
-
31
-
32
-
33
-
34
-
35
-
36
-
37
-
38
-
39
-
40
-
 41
41 -
 42
42 -
 43
43 -
 44
44 -
 45
45 -
 46
46 -
 47
47 -
 48
48 -
 49
49 -
 50
50 -
 51
51 -
 52
52 -
 53
53 -
 54
54 -
 55
55 -
 56
56 -
 57
57 -
 58
58 -
 59
59 -
 60
60 -
 61
61 -
62
-
63
-
64
-
65
-
66
-
67
-
68
-
69
-
70
-
71
-
72
-
73
-
74
-
75
-
76
-
77
-
78
-
79
-
80
-
81
-
82
-
83
 |
 |

51
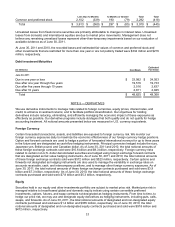
In June 2010, we issued $1.25 billion of zero-coupon debt securities that are convertible into shares of our
common stock if certain conditions are met. As of June 30, 2011, none of these securities had met price or other
conditions that would make them eligible for issuance and therefore were excluded from the calculation of either
the basic or diluted EPS. See Note 12 – Debt for additional information.
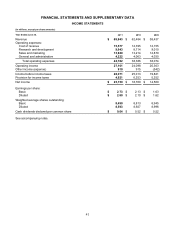
NOTE 3 — OTHER INCOME (EXPENSE)
The components of other income (expense) were as follows:
(In millions)
Y
ear Ended June 30, 2011 2010 2009
Dividends and interest income $ 900 $ 843 $ 744
Interest expense (295) (151) (38)
Net recognized gains (losses) on investments 439 348 (125)
Net losses on derivatives (77) (140) (558)
Net gains (losses) on foreign currency remeasurements (26) 1 (509)
Other (31) 14 (56)
Total $ 910 $ 915 $ (542)
Following are details of net recognized gains (losses) on investments during the periods reported:
(In millions)
Y
ear Ended June 30, 2011 2010 2009
Other-than-temporary impairments of investments $ (80) $ (69) $ (862)
Realized gains from sales of available-for-sale securities 734 605 1,634
Realized losses from sales of available-for-sale securities (215) (188) (897)
Total $ 439 $ 348 $ (125)
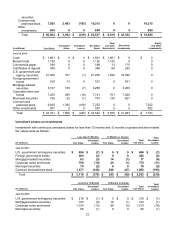
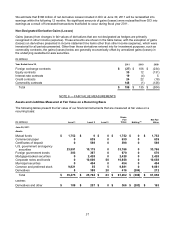
NOTE 4 — INVESTMENTS
Investment Components
The components of investments, including associated derivatives, were as follows:
(In millions) Cost Basis Unrealized
Gains Unrealized
Losses
Recorded
Basis
Cash
and Cash
Equivalents
Short-term
Investments
Equity
and Other
Investments
June 30, 2011
Cash $ 1,648 $ 0 $ 0 $ 1,648 $ 1,648 $ 0 $ 0
Mutual funds 1,752 0 0 1,752 1,752 0 0
Commercial
paper 639 0 0 639 414 225 0
Certificates of
deposit 598 0 0 598 372 226 0
U.S. government
and agency
securities 33,607 162 (7) 33,762 2,049 31,713 0
Foreign
government
bonds 658 11 (2) 667 0 667 0
Mortgage-backed
securities 2,307 121 (4) 2,424 0 2,424 0
Corporate notes
and bonds 10,575 260 (11) 10,824 3,375 7,449 0
Municipal 441 15 (2) 454 0 454 0