Microsoft 2011 Annual Report Download - page 58
Download and view the complete annual report
Please find page 58 of the 2011 Microsoft annual report below. You can navigate through the pages in the report by either clicking on the pages listed below, or by using the keyword search tool below to find specific information within the annual report.-
 1
1 -
2
-
3
-
4
-
5
-
6
-
7
-
8
-
9
-
10
-
11
-
12
-
13
-
14
-
15
-
16
-
17
-
18
-
19
-
20
-
21
-
22
-
23
-
24
-
25
-
26
-
27
-
28
-
29
-
30
-
31
-
32
-
33
-
34
-
35
-
36
-
37
-
38
-
39
-
40
-
41
-
42
-
43
-
44
-
45
-
46
-
47
-
 48
48 -
 49
49 -
 50
50 -
 51
51 -
 52
52 -
 53
53 -
 54
54 -
 55
55 -
 56
56 -
 57
57 -
 58
58 -
 59
59 -
 60
60 -
 61
61 -
 62
62 -
 63
63 -
 64
64 -
 65
65 -
 66
66 -
 67
67 -
 68
68 -
69
-
70
-
71
-
72
-
73
-
74
-
75
-
76
-
77
-
78
-
79
-
80
-
81
-
82
-
83
 |
 |

58
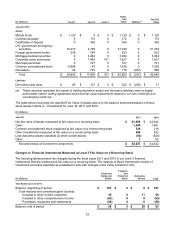
(In millions) Level 1 Level 2 Level 3
Gross
Fair
Value Netting (a) Net Fair
Value
June 30, 2010
Assets
Mutual funds $ 1,120 $ 0 $ 0 $ 1,120 $ 0 $ 1,120
Commercial paper 0 172 0 172 0 172
Certificates of deposit 0 348 0 348 0 348
U.S. government and agency
securities 16,473 4,756 0 21,229 0 21,229
Foreign government bonds 239 294 0 533 0 533
Mortgage-backed securities 0 3,264 0 3,264 0 3,264
Corporate notes and bonds 0 7,460 167 7,627 0 7,627
Municipal securities 0 747 0 747 0 747
Common and preferred stock 6,988 43 5 7,036 0 7,036
Derivatives 22 745 9 776 (207) 569
Total $ 24,842 $ 17,829 $ 181 $ 42,852 $ (207) $ 42,645
Liabilities
Derivatives and other $ 85 $ 137 $ 0 $ 222 $ (205) $ 17
(a) These amounts represent the impact of netting derivative assets and derivative liabilities when a legally
enforceable master netting agreement exists and fair value adjustments related to our own credit risk and
counterparty credit risk.
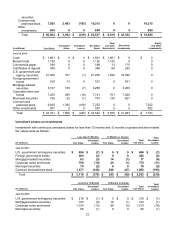
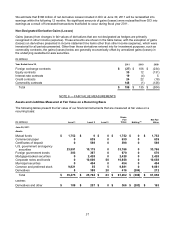
The table below reconciles the total Net Fair Value of assets above to the balance sheet presentation of these
same assets in Note 4 – Investments for June 30, 2011 and 2010.
(In millions)
June 30, 2011 2010
Net fair value of assets measured at fair value on a recurring basis $ 61,058 $ 42,645
Cash 1,648
1,661
Common and preferred stock measured at fair value on a nonrecurring basis 334
216
Other investments measured at fair value on a nonrecurring basis 650
502
Less derivative assets classified as other current assets (54) (544)
Other 1
62
Recorded basis of investment components $ 63,637
$ 44,542
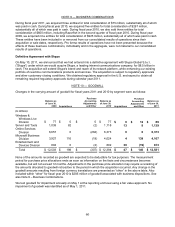
Changes in Financial Instruments Measured at Level 3 Fair Value on a Recurring Basis
The following tables present the changes during the fiscal years 2011 and 2010 in our Level 3 financial
instruments that are measured at fair value on a recurring basis. The majority of these instruments consist of
investment securities classified as available-for-sale with changes in fair value included in OCI.
(In millions)
Corporate
Notes and
Bonds
Common
and
Preferred
Stock Derivative
Assets Total
Y
ear Ended June 30, 2011
Balance, beginning of period $ 167 $ 5 $ 9 $ 181
Total realized and unrealized gains (losses):
Included in other income (expense) 39 0 11 50
Included in other comprehensive income (63) 0 0 (63)
Purchases, issuances and settlements (85) 0 0 (85)
Balance, end of period $ 58 $ 5 $ 20 $ 83