Microsoft 2011 Annual Report Download - page 40
Download and view the complete annual report
Please find page 40 of the 2011 Microsoft annual report below. You can navigate through the pages in the report by either clicking on the pages listed below, or by using the keyword search tool below to find specific information within the annual report.-
 1
1 -
2
-
3
-
4
-
5
-
6
-
7
-
8
-
9
-
10
-
11
-
12
-
13
-
14
-
15
-
16
-
17
-
18
-
19
-
20
-
21
-
22
-
23
-
24
-
25
-
26
-
27
-
28
-
29
-
 30
30 -
 31
31 -
 32
32 -
 33
33 -
 34
34 -
 35
35 -
 36
36 -
 37
37 -
 38
38 -
 39
39 -
 40
40 -
 41
41 -
 42
42 -
 43
43 -
 44
44 -
 45
45 -
 46
46 -
 47
47 -
 48
48 -
 49
49 -
 50
50 -
51
-
52
-
53
-
54
-
55
-
56
-
57
-
58
-
59
-
60
-
61
-
62
-
63
-
64
-
65
-
66
-
67
-
68
-
69
-
70
-
71
-
72
-
73
-
74
-
75
-
76
-
77
-
78
-
79
-
80
-
81
-
82
-
83
 |
 |

40
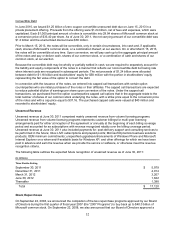
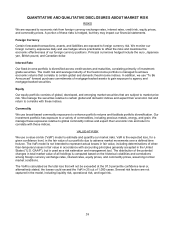
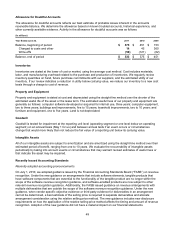
The following table sets forth the one-day VaR for substantially all of our positions as of June 30, 2011 and 2010
and for the year ended June 30, 2011:
(In millions)
June 30,
2011
June 30,
2010
Y
ear Ended June 30,
2011
Risk Categories Average High Low
Foreign currency $ 86
$ 57
$ 67 $ 121 $ 40
Interest rate $ 58
$ 58
$ 56 $ 65 $ 50
Equity $ 212 $ 183 $ 211 $ 230 $ 184
Commodity $ 28
$ 19
$ 22 $ 30 $ 18
Total one-day VaR for the combined risk categories was $290 million at June 30, 2011 and $235 million at
June 30, 2010. The total VaR is 25% less at June 30, 2011, and 26% less at June 30, 2010, than the sum of the
separate risk categories in the above table due to the diversification benefit of the combination of risks.