Microsoft 2011 Annual Report Download - page 25
Download and view the complete annual report
Please find page 25 of the 2011 Microsoft annual report below. You can navigate through the pages in the report by either clicking on the pages listed below, or by using the keyword search tool below to find specific information within the annual report.-
 1
1 -
2
-
3
-
4
-
5
-
6
-
7
-
8
-
9
-
10
-
11
-
12
-
13
-
14
-
 15
15 -
 16
16 -
 17
17 -
 18
18 -
 19
19 -
 20
20 -
 21
21 -
 22
22 -
 23
23 -
 24
24 -
 25
25 -
 26
26 -
 27
27 -
 28
28 -
 29
29 -
 30
30 -
 31
31 -
 32
32 -
 33
33 -
 34
34 -
 35
35 -
36
-
37
-
38
-
39
-
40
-
41
-
42
-
43
-
44
-
45
-
46
-
47
-
48
-
49
-
50
-
51
-
52
-
53
-
54
-
55
-
56
-
57
-
58
-
59
-
60
-
61
-
62
-
63
-
64
-
65
-
66
-
67
-
68
-
69
-
70
-
71
-
72
-
73
-
74
-
75
-
76
-
77
-
78
-
79
-
80
-
81
-
82
-
83
 |
 |

25
MBD operating income increased due mainly to decreased operating expenses, offset in part by decreased
revenue. Sales and marketing expenses decreased $203 million or 5%, primarily driven by a decrease in
corporate marketing activities. Research and development expenses decreased $202 million or 9%, primarily as a
result of capitalization of certain Microsoft Office system software development costs and lower headcount-related
expenses. General and administrative expenses decreased $50 million or 17% primarily due to expenses in the
prior year associated with the acquisition of Fast Search & Transfer ASA (“FAST”) and lower headcount-related
expenses. These decreases were offset in part by a $135 million or 12% increase in cost of revenue, primarily
driven by increased traffic acquisition costs and increased costs of providing services.
Entertainment and Devices Division
(In millions, except percentages) 2011 2010 2009
Percentage
Change 2011
Versus 2010
Percentage
Change 2010
Versus 2009
Revenue $ 8,913 $ 6,168 $ 6,416 45% (4)%
Operating income $ 1,324
$ 618 $ 351 114% 76%
Entertainment and Devices Division (“EDD”) develops and markets products and services designed to entertain
and connect people. EDD offerings include the Xbox 360 entertainment platform (which includes the Xbox 360
gaming and entertainment console, Kinect for Xbox 360, Xbox 360 video games, Xbox LIVE, and Xbox 360
accessories), Mediaroom (our Internet protocol television software), and Windows Phone. In November 2010, we
released Kinect for Xbox 360 and the latest version of Windows Phone.
Fiscal year 2011 compared with fiscal year 2010
EDD revenue increased primarily reflecting higher Xbox 360 platform revenue. Xbox 360 platform revenue grew
$2.7 billion or 48%, led by increased volumes of Xbox 360 consoles, sales of Kinect sensors, and higher Xbox
LIVE revenue. We shipped 13.7 million Xbox 360 consoles during fiscal year 2011, compared with 10.3 million
Xbox 360 consoles during fiscal year 2010.
EDD operating income increased primarily reflecting revenue growth, offset in part by higher cost of revenue.
Cost of revenue increased $1.8 billion or 49% primarily reflecting higher volumes of Xbox 360 consoles and
Kinect sensors sold, and increased royalty costs resulting from increased sales of Xbox LIVE digital content.
Research and development expenses increased $119 million or 12%, primarily reflecting higher headcount-
related costs. Sales and marketing expenses grew $90 million or 12% primarily reflecting increased Xbox 360
platform marketing activities.
Fiscal year 2010 compared with fiscal year 2009
EDD revenue decreased reflecting decreased revenue from Xbox 360 platform and PC games. Xbox 360 platform
and PC game revenue decreased $12 million, primarily reflecting a reduction in Xbox 360 consoles sold and
revenue per console, offset in part by increased Xbox LIVE revenue. We shipped 10.3 million Xbox 360 consoles
during fiscal year 2010, compared with 11.2 million Xbox 360 consoles during fiscal year 2009. Non-gaming
revenue decreased $197 million or 25% primarily reflecting decreased Zune and Windows Phone revenue.
EDD operating income increased due to reduced operating expenses. Cost of revenue decreased $496 million or
12%, primarily due to lower Xbox 360 console costs, offset in part by increased royalty costs resulting from
increased Xbox LIVE digital marketplace third-party content sales and charges resulting from the discontinuation
of the KIN phone. Sales and marketing costs decreased $75 million or 9%, primarily due to decreased Xbox 360
platform marketing activities. Research and development expenses increased $54 million or 6%, primarily
reflecting increased headcount-related expenses, offset in part by decreased third-party development and
programming costs.
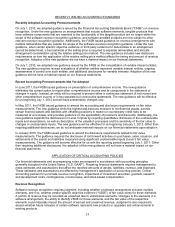
Corporate-Level Activity
(In millions, except percentages) 2011 2010 2009
Percentage
Change 2011
Versus 2010
Percentage
Change 2010
Versus 2009
Corporate-level activity $ (4,619) $ (4,260) $ (4,318) (8)% 1%