Microsoft 2011 Annual Report Download - page 52
Download and view the complete annual report
Please find page 52 of the 2011 Microsoft annual report below. You can navigate through the pages in the report by either clicking on the pages listed below, or by using the keyword search tool below to find specific information within the annual report.-
 1
1 -
2
-
3
-
4
-
5
-
6
-
7
-
8
-
9
-
10
-
11
-
12
-
13
-
14
-
15
-
16
-
17
-
18
-
19
-
20
-
21
-
22
-
23
-
24
-
25
-
26
-
27
-
28
-
29
-
30
-
31
-
32
-
33
-
34
-
35
-
36
-
37
-
38
-
39
-
40
-
41
-
 42
42 -
 43
43 -
 44
44 -
 45
45 -
 46
46 -
 47
47 -
 48
48 -
 49
49 -
 50
50 -
 51
51 -
 52
52 -
 53
53 -
 54
54 -
 55
55 -
 56
56 -
 57
57 -
 58
58 -
 59
59 -
 60
60 -
 61
61 -
 62
62 -
63
-
64
-
65
-
66
-
67
-
68
-
69
-
70
-
71
-
72
-
73
-
74
-
75
-
76
-
77
-
78
-
79
-
80
-
81
-
82
-
83
 |
 |

52
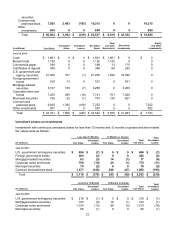
securities
Common and
preferred stock 7,925 2,483 (193) 10,215 0 0 10,215
Other
investments 654 0 0 654 0 4 650
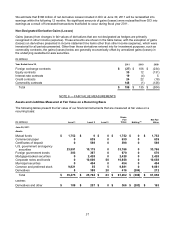
Total $ 60,804 $ 3,052 $ (219) $ 63,637 $ 9,610 $ 43,162 $ 10,865
(In millions) Cost Basis Unrealized
Gains Unrealized
Losses
Recorded
Basis
Cash
and Cash
Equivalents
Short-term
Investments
Equity
and Other
Investments
June 30, 2010
Cash $ 1,661 $ 0 $ 0 $ 1,661 $ 1,661 $ 0 $ 0
Mutual funds 1,120 0 0 1,120 1,120 0 0
Commercial paper 188 0 0 188 13 175 0
Certificates of deposit 348 0 0 348 68 280 0
U.S. government and
agency securities 21,036 167 (1) 21,202 1,822 19,380 0
Foreign government
bonds 518 13 0 531 0 531 0
Mortgage-backed
securities 3,137 135 (7) 3,265 0 3,265 0
Corporate notes and
bonds 7,450 289 (18) 7,721 701 7,020 0
Municipal securities 726 22 (1) 747 120 627 0
Common and
preferred stock 6,640 1,030 (418) 7,252 0 0 7,252
Other investments 507 0 0 507 0 5 502
Total $ 43,331 $ 1,656 $ (445) $ 44,542 $ 5,505 $ 31,283 $ 7,754
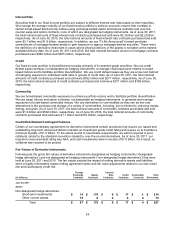
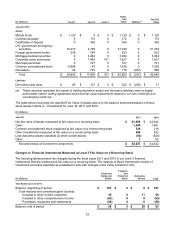
Unrealized Losses on Investments
Investments with continuous unrealized losses for less than 12 months and 12 months or greater and their related
fair values were as follows:
Less than 12 Months 12 Months or Greater
Total
Fair Value
Total
Unrealized
Losses
(In millions) Fair Value
Unrealized
Losses Fair Value
Unrealized
Losses
June 30, 2011
U.S. government and agency securities $ 484 $ (7) $ 0 $ 0 $ 484 $ (7)
Foreign government bonds 365 (2) 0 0 365 (2)
Mortgage-backed securities 63 (3) 14 (1) 77 (4)
Corporate notes and bonds 750 (10) 25 (1) 775 (11)
Municipal securities 79 (2) 0 0 79 (2)
Common and preferred stock 1,377 (146) 206 (47) 1,583 (193)
Total $ 3,118 $ (170) $ 245 $ (49) $ 3,363 $ (219)
Less than 12 Months 12 Months or Greater
Total
Fair Value
Total
Unrealized
Losses
(In millions) Fair Value
Unrealized
Losses Fair Value
Unrealized
Losses
June 30, 2010
U.S. government and agency securities $ 216 $ (1) $ 0 $ 0 $ 216 $ (1)
Mortgage-backed securities 105 (6) 18 (1) 123 (7)
Corporate notes and bonds 1,124 (13) 89 (5) 1,213 (18)
Municipal securities 66 (1) 0 0 66 (1)