Microsoft 2011 Annual Report Download - page 21
Download and view the complete annual report
Please find page 21 of the 2011 Microsoft annual report below. You can navigate through the pages in the report by either clicking on the pages listed below, or by using the keyword search tool below to find specific information within the annual report.-
 1
1 -
2
-
3
-
4
-
5
-
6
-
7
-
8
-
9
-
10
-
 11
11 -
 12
12 -
 13
13 -
 14
14 -
 15
15 -
 16
16 -
 17
17 -
 18
18 -
 19
19 -
 20
20 -
 21
21 -
 22
22 -
 23
23 -
 24
24 -
 25
25 -
 26
26 -
 27
27 -
 28
28 -
 29
29 -
 30
30 -
 31
31 -
32
-
33
-
34
-
35
-
36
-
37
-
38
-
39
-
40
-
41
-
42
-
43
-
44
-
45
-
46
-
47
-
48
-
49
-
50
-
51
-
52
-
53
-
54
-
55
-
56
-
57
-
58
-
59
-
60
-
61
-
62
-
63
-
64
-
65
-
66
-
67
-
68
-
69
-
70
-
71
-
72
-
73
-
74
-
75
-
76
-
77
-
78
-
79
-
80
-
81
-
82
-
83
 |
 |

21
Diluted earnings per share increased reflecting increased net income and the repurchase of 380 million shares
during fiscal year 2010.
SEGMENT PRODUCT REVENUE/OPERATING INCOME (LOSS)
The revenue and operating income (loss) amounts in this section are presented on a basis consistent with
accounting principles generally accepted in the U.S. (“U.S. GAAP”) and include certain reconciling items
attributable to each of the segments. Segment information appearing in Note 21 – Segment Information and
Geographic Data of the Notes to Financial Statements is presented on a basis consistent with our current internal
management reporting. Certain corporate-level activity has been excluded from segment operating results and is
analyzed separately.
We have recast certain prior period amounts within this MD&A to conform to the way we internally managed and
monitored segment performance during the current fiscal year, including moving Microsoft’s PC hardware
business from Entertainment and Devices Division to Windows & Windows Live Division, Windows Embedded
from Entertainment and Devices Division to Server and Tools, and Office for Mac from Entertainment and Devices
Division to Microsoft Business Division, as well as implementing intersegment cost allocations between all
segments related to the collaborative investment in mobile platform development.
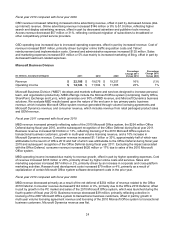
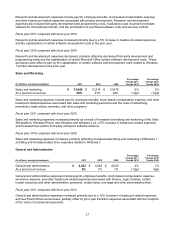
Windows & Windows Live Division
(In millions, except percentages) 2011 2010 2009
Percentage
Change 2011
Versus 2010
Percentage
Change 2010
Versus 2009
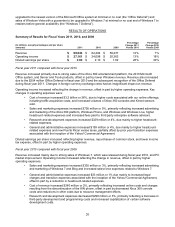
Revenue $ 19,024 $ 19,494 $ 15,847 (2)% 23%
Operating income $ 12,281 $ 13,034 $ 9,790 (6)% 33%
Windows & Windows Live Division (“Windows Division”) develops and markets PC operating systems, related
software and online services, and PC hardware products. This collection of software, hardware, and services is
designed to simplify everyday tasks through efficient browsing capabilities and seamless operations across the
user’s hardware and software. Windows Division offerings consist of multiple editions of the Windows operating
system, software and services through Windows Live, and Microsoft PC hardware products.
Windows Division revenue is largely correlated to the PC market worldwide, as approximately 75% of total
Windows Division revenue comes from Windows operating system software purchased by original equipment
manufacturers (“OEMs”) which they pre-install on equipment they sell. The remaining approximately 25% of
Windows Division revenue (“other revenue”) is generated by commercial and retail sales of Windows and PC
hardware products and online advertising from Windows Live.
Fiscal year 2011 compared with fiscal year 2010
Windows Division revenue reflected relative performance in PC market segments. We estimate that sales of PCs
to businesses grew approximately 11% this year and sales of PCs to consumers declined approximately 1%. The
decline in consumer PC sales included an approximately 32% decline in the sales of netbooks. Taken together,
the total PC market increased an estimated 2% to 4%. Revenue was negatively impacted by the effect of higher
growth in emerging markets, where average selling prices are lower, relative to developed markets, and by lower
recognition of previously deferred Windows XP revenue. Considering the impact of Windows 7 launch in the prior
year, including $273 million of revenue recognized related to the Windows 7 Deferral, we estimate that Windows
Division revenue was in line with the PC market.
Windows Division operating income decreased as a result of decreased revenue and higher sales and marketing
expenses. Sales and marketing expenses increased $224 million or 8% reflecting increased advertising of
Windows and Windows Live.
Fiscal year 2010 compared with fiscal year 2009
Windows Division revenue increased primarily as a result of strong sales of Windows 7 and PC market
improvement. We estimate total PC shipments from all sources grew approximately 16% to 18%. OEM revenue
increased $2.6 billion or 22%, while OEM license units increased 21%. The OEM revenue increase was driven by
PC market growth, higher Windows attach rates across consumer and business segments, the restoration of