Microsoft 2011 Annual Report Download - page 61
Download and view the complete annual report
Please find page 61 of the 2011 Microsoft annual report below. You can navigate through the pages in the report by either clicking on the pages listed below, or by using the keyword search tool below to find specific information within the annual report.-
 1
1 -
2
-
3
-
4
-
5
-
6
-
7
-
8
-
9
-
10
-
11
-
12
-
13
-
14
-
15
-
16
-
17
-
18
-
19
-
20
-
21
-
22
-
23
-
24
-
25
-
26
-
27
-
28
-
29
-
30
-
31
-
32
-
33
-
34
-
35
-
36
-
37
-
38
-
39
-
40
-
41
-
42
-
43
-
44
-
45
-
46
-
47
-
48
-
49
-
50
-
 51
51 -
 52
52 -
 53
53 -
 54
54 -
 55
55 -
 56
56 -
 57
57 -
 58
58 -
 59
59 -
 60
60 -
 61
61 -
 62
62 -
 63
63 -
 64
64 -
 65
65 -
 66
66 -
 67
67 -
 68
68 -
 69
69 -
 70
70 -
 71
71 -
72
-
73
-
74
-
75
-
76
-
77
-
78
-
79
-
80
-
81
-
82
-
83
 |
 |

61
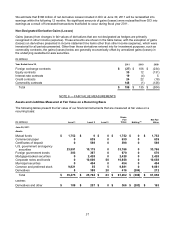
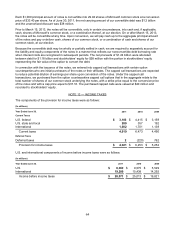
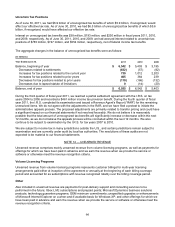
NOTE 11 — INTANGIBLE ASSETS
The components of intangible assets, all of which are finite-lived, were as follows:
(In millions)
Gross
Carrying
Amount Accumulated
Amortization
Net Carrying
Amount
Gross
Carrying
Amount
Accumulated
Amortization Net Carrying
Amount
Y
ear Ended June 30, 2011 2010
Contract-based $ 1,068 $ (966) $ 102 $ 1,075 $ (914) $ 161
Technology-based (a) 2,356 (1,831) 525
2,308 (1,521) 787
Marketing-related 113 (98) 15
114 (86) 28
Customer-related 326 (224) 102
390 (208) 182
Total $ 3,863 $ (3,119) $ 744
$ 3,887 $ (2,729) $ 1,158
(a) Technology-based intangible assets included $179 million and $249 million as of June 30, 2011 and 2010,
respectively, of net carrying amount of software to be sold, leased, or otherwise marketed.
We estimate that we have no significant residual value related to our intangible assets. No material impairments
of intangible assets were identified during any of the periods presented.
The components of intangible assets acquired during fiscal years 2011 and 2010 were as follows:
(In millions) Amount
Weighted
Average Life Amount Weighted
Average Life
Y
ear Ended June 30, 2011 2010
Contract-based $ 0 $ 3 2 years
Technology-based 119 3 years 322 4 years
Marketing-related 1 7 years
0
Customer-related 2 4 years
18 5 years
Total $ 122 3 years
$ 343 4 years
Intangible assets amortization expense was $537 million, $707 million, and $591 million for fiscal years 2011,
2010, and 2009, respectively. Amortization of capitalized software was $114 million, $97 million, and $65 million
for fiscal years 2011, 2010, and 2009, respectively.
The following table outlines the estimated future amortization expense related to intangible assets held at
June 30, 2011:
(In millions)
Y
ear Ending June 30,
2012 $ 390
2013 242
2014 68
2015 27
2016 10
2017 and thereafter 7
Total $ 744