Microsoft 2011 Annual Report Download - page 5
Download and view the complete annual report
Please find page 5 of the 2011 Microsoft annual report below. You can navigate through the pages in the report by either clicking on the pages listed below, or by using the keyword search tool below to find specific information within the annual report.-
 1
1 -
 2
2 -
 3
3 -
 4
4 -
 5
5 -
 6
6 -
 7
7 -
 8
8 -
 9
9 -
 10
10 -
 11
11 -
 12
12 -
 13
13 -
 14
14 -
 15
15 -
 16
16 -
17
-
18
-
19
-
20
-
21
-
22
-
23
-
24
-
25
-
26
-
27
-
28
-
29
-
30
-
31
-
32
-
33
-
34
-
35
-
36
-
37
-
38
-
39
-
40
-
41
-
42
-
43
-
44
-
45
-
46
-
47
-
48
-
49
-
50
-
51
-
52
-
53
-
54
-
55
-
56
-
57
-
58
-
59
-
60
-
61
-
62
-
63
-
64
-
65
-
66
-
67
-
68
-
69
-
70
-
71
-
72
-
73
-
74
-
75
-
76
-
77
-
78
-
79
-
80
-
81
-
82
-
83
 |
 |

5
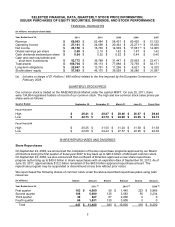
SELECTED FINANCIAL DATA, QUARTERLY STOCK PRICE INFORMATION,
ISSUER PURCHASES OF EQUITY SECURITIES, DIVIDENDS, AND STOCK PERFORMANCE
FINANCIAL HIGHLIGHTS
(In millions, except per share data)
Y
ear Ended June 30, 2011 2010 2009 2008 2007
Revenue $ 69,943 $ 62,484 $ 58,437 $ 60,420 $ 51,122
Operating income $ 27,161 $ 24,098 $ 20,363 $ 22,271
(a) $ 18,438
Net income $ 23,150 $ 18,760 $ 14,569 $ 17,681
(a) $ 14,065
Diluted earnings per share $ 2.69 $2.10$1.62$ 1.87 $1.42
Cash dividends declared per share $ 0.64 $0.52$0.52$ 0.44 $0.40
Cash and cash equivalents and
short-term investments $ 52,772
$ 36,788 $ 31,447 $ 23,662 $ 23,411
Total assets $ 108,704 $ 86,113 $ 77,888 $ 72,793 $ 63,171
Long-term obligations $ 22,847 $ 13,791 $ 11,296 $ 6,621 $ 8,320
Stockholders’ equity $ 57,083 $ 46,175 $ 39,558 $ 36,286 $ 31,097
(a) Includes a charge of $1.4 billion (€899 million) related to the fine imposed by the European Commission in
February 2008.
QUARTERLY STOCK PRICE
Our common stock is traded on the NASDAQ Stock Market under the symbol MSFT. On July 20, 2011, there
were 134,854 registered holders of record of our common stock. The high and low common stock sales prices per
share were as follows:
Quarter Ended September 30 December 31 March 31 June 30 Fiscal
Y
ea
r
Fiscal Year 2011
High $ 26.41 $ 28.87 $ 29.46 $ 26.87 $ 29.46
Low $ 22.73 $ 23.78 $ 24.68 $ 23.65 $ 22.73
Fiscal Year 2010
High $ 26.25 $ 31.50 $ 31.24 $ 31.58 $ 31.58
Low $ 22.00 $ 24.43 $ 27.57 $ 22.95 $ 22.00
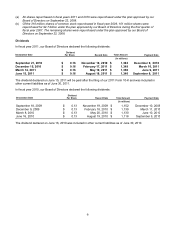
SHARE REPURCHASES AND DIVIDENDS
Share Repurchases
On September 22, 2008, we announced the completion of the two repurchase programs approved by our Board
of Directors during the first quarter of fiscal year 2007 to buy back up to $40.0 billion of Microsoft common stock.
On September 22, 2008, we also announced that our Board of Directors approved a new share repurchase
program authorizing up to $40.0 billion in share repurchases with an expiration date of September 30, 2013. As of
June 30, 2011, approximately $12.2 billion remained of the $40.0 billion approved repurchase amount. The
repurchase program may be suspended or discontinued at any time without prior notice.
We repurchased the following shares of common stock under the above-described repurchase plans using cash
resources:
(In millions) Shares
A
mount Shares
A
mount Shares
A
mount
Y
ear Ended June 30, 2011 (a) 2010 (a)
2009 (b)
First quarter 163 $ 4,000 58 $ 1,445 223 $ 5,966
Second quarter 188 5,000 125 3,583 95 2,234
Third quarter 30 827 67 2,000 0 0
Fourth quarter 66 1,631 130 3,808 0 0
Total 447 $ 11,458 380 $ 10,836 318 $ 8,200