Microsoft 2011 Annual Report Download - page 20
Download and view the complete annual report
Please find page 20 of the 2011 Microsoft annual report below. You can navigate through the pages in the report by either clicking on the pages listed below, or by using the keyword search tool below to find specific information within the annual report.
20
upgraded to the newest version of the Microsoft Office system at minimal or no cost (the “Office Deferral”) and
sales of Windows Vista with a guarantee to be upgraded to Windows 7 at minimal or no cost and of Windows 7 to
retailers before general availability (the “Windows 7 Deferral”).
RESULTS OF OPERATIONS
Summary of Results for Fiscal Years 2011, 2010, and 2009
(In millions, except percentages and per share
amounts) 2011 2010 2009
Percentage
Change 2011
Versus 2010
Percentage
Change 2010
Versus 2009
Revenue $ 69,943 $ 62,484 $ 58,437 12% 7%
Operating income $ 27,161
$ 24,098 $ 20,363 13% 18%
Diluted earnings per share $ 2.69
$ 2.10 $ 1.62 28% 30%
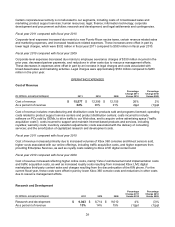
Fiscal year 2011 compared with fiscal year 2010
Revenue increased primarily due to strong sales of the Xbox 360 entertainment platform, the 2010 Microsoft
Office system, and Server and Tools products, offset in part by lower Windows revenue. Revenue also increased
due to the $254 million Office Deferral in fiscal year 2010 and the subsequent recognition of the Office Deferral
during fiscal year 2011. Changes in foreign currency exchange rates had an insignificant impact on revenue.
Operating income increased reflecting the change in revenue, offset in part by higher operating expenses. Key
changes in operating expenses were:
• Cost of revenue increased $3.2 billion or 26%, due to higher costs associated with our online offerings,
including traffic acquisition costs, and increased volumes of Xbox 360 consoles and Kinect sensors
sold.
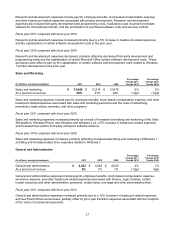
• Sales and marketing expenses increased $726 million or 5%, primarily reflecting increased advertising
and marketing of the Xbox 360 platform, Windows Phone, and Windows and Windows Live, higher
headcount-related expenses and increased fees paid to third party enterprise software advisors.
• Research and development expenses increased $329 million or 4%, due mainly to higher headcount-
related expenses.
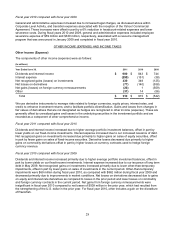
• General and administrative expenses increased $159 million or 4%, due mainly to higher headcount-
related expenses and new Puerto Rican excise taxes, partially offset by prior year transition expenses
associated with the inception of the Yahoo! Commercial Agreement.
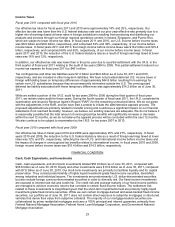
Diluted earnings per share increased reflecting higher revenue, repurchases of common stock, and lower income
tax expense, offset in part by higher operating expenses.
Fiscal year 2010 compared with fiscal year 2009
Revenue increased mainly due to strong sales of Windows 7, which was released during fiscal year 2010, and PC
market improvement. Operating income increased reflecting the change in revenue, offset in part by higher
operating expenses.
• Sales and marketing expenses increased $335 million or 3%, primarily reflecting increased advertising
and marketing of Windows 7 and Bing and increased sales force expenses related to Windows 7.
• General and administrative expenses increased $33 million or 1% due mainly to increased legal
charges and transition expenses associated with the inception of the Yahoo! Commercial Agreement,
offset in part by a reduction in headcount-related expenses.
• Cost of revenue increased $240 million or 2%, primarily reflecting increased online costs and charges
resulting from the discontinuation of the KIN phone, offset in part by decreased Xbox 360 console
costs and reductions in other costs due to resource management efforts.
• Research and development expenses decreased $296 million or 3%, primarily reflecting a decrease in
third-party development and programming costs and increased capitalization of certain software
development costs.


