Microsoft 2011 Annual Report Download - page 65
Download and view the complete annual report
Please find page 65 of the 2011 Microsoft annual report below. You can navigate through the pages in the report by either clicking on the pages listed below, or by using the keyword search tool below to find specific information within the annual report.-
 1
1 -
2
-
3
-
4
-
5
-
6
-
7
-
8
-
9
-
10
-
11
-
12
-
13
-
14
-
15
-
16
-
17
-
18
-
19
-
20
-
21
-
22
-
23
-
24
-
25
-
26
-
27
-
28
-
29
-
30
-
31
-
32
-
33
-
34
-
35
-
36
-
37
-
38
-
39
-
40
-
41
-
42
-
43
-
44
-
45
-
46
-
47
-
48
-
49
-
50
-
51
-
52
-
53
-
54
-
 55
55 -
 56
56 -
 57
57 -
 58
58 -
 59
59 -
 60
60 -
 61
61 -
 62
62 -
 63
63 -
 64
64 -
 65
65 -
 66
66 -
 67
67 -
 68
68 -
 69
69 -
 70
70 -
 71
71 -
 72
72 -
 73
73 -
 74
74 -
 75
75 -
76
-
77
-
78
-
79
-
80
-
81
-
82
-
83
 |
 |

65
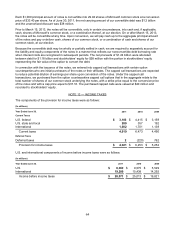
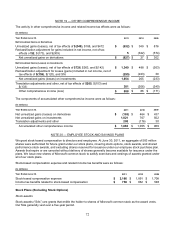
The items accounting for the difference between income taxes computed at the U.S. federal statutory rate and our
effective rate were as follows:
Y
ear Ended June 30, 2011 2010 2009
Federal statutory rate 35.0%
35.0% 35.0%
Effect of:
Foreign earnings taxed at lower rates (15.6)%
(12.1)% (9.3)%
Internal Revenue Service settlement (1.7)%
0% 0%
Other reconciling items, net (0.2)%
2.1% 0.8%
Effective rate 17.5%
25.0% 26.5%
The reduction from the federal statutory rate from foreign earnings taxed at lower rates results from producing and
distributing our products and services through our foreign regional operations centers in Ireland, Singapore, and
Puerto Rico, which are subject to lower income tax rates. In general, other reconciling items consist of interest,
U.S. state income taxes, domestic production deductions, and credits. In fiscal years 2011, 2010, and 2009, there
were no individually significant other reconciling items. The I.R.S. settlement is discussed below.
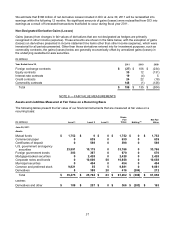
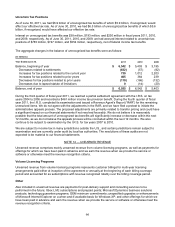
The components of the deferred income tax assets and liabilities were as follows:
(In millions)
June 30, 2011 2010
Deferred Income Tax Assets
Stock-based compensation expense $ 1,079
$ 1,329
Other expense items 1,411
1,696
Unearned revenue 463
556
Impaired investments 424
289
Other revenue items 69
80
Deferred income tax assets $ 3,446
$ 3,950
Deferred Income Tax Liabilities
International earnings $ (1,266) $ (1,056)
Unrealized gain on investments (904) (674)
Other (265) (265)
Deferred income tax liabilities (2,435) (1,995)
Net deferred income tax assets $ 1,011
$ 1,955
Reported As
Current deferred income tax assets $ 2,467
$ 2,184
Long-term deferred income tax liabilities (1,456) (229)
Net deferred income tax assets $ 1,011
$ 1,955
Deferred income tax balances reflect the effects of temporary differences between the carrying amounts of assets
and liabilities and their tax bases and are stated at enacted tax rates expected to be in effect when the taxes are
actually paid or recovered.
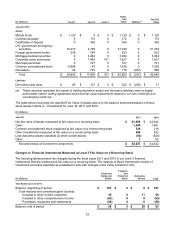
We have not provided deferred U.S. income taxes or foreign withholding taxes on temporary differences of
approximately $44.8 billion resulting from earnings for certain non-U.S. subsidiaries which are permanently
reinvested outside the U.S. The unrecognized deferred tax liability associated with these temporary differences is
approximately $14.2 billion.
Income taxes paid were $5.3 billion, $4.1 billion, and $6.6 billion in fiscal years 2011, 2010, and 2009,
respectively.