Microsoft 2011 Annual Report Download - page 41
Download and view the complete annual report
Please find page 41 of the 2011 Microsoft annual report below. You can navigate through the pages in the report by either clicking on the pages listed below, or by using the keyword search tool below to find specific information within the annual report.-
 1
1 -
2
-
3
-
4
-
5
-
6
-
7
-
8
-
9
-
10
-
11
-
12
-
13
-
14
-
15
-
16
-
17
-
18
-
19
-
20
-
21
-
22
-
23
-
24
-
25
-
26
-
27
-
28
-
29
-
30
-
 31
31 -
 32
32 -
 33
33 -
 34
34 -
 35
35 -
 36
36 -
 37
37 -
 38
38 -
 39
39 -
 40
40 -
 41
41 -
 42
42 -
 43
43 -
 44
44 -
 45
45 -
 46
46 -
 47
47 -
 48
48 -
 49
49 -
 50
50 -
 51
51 -
52
-
53
-
54
-
55
-
56
-
57
-
58
-
59
-
60
-
61
-
62
-
63
-
64
-
65
-
66
-
67
-
68
-
69
-
70
-
71
-
72
-
73
-
74
-
75
-
76
-
77
-
78
-
79
-
80
-
81
-
82
-
83
 |
 |

41
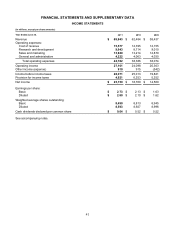
FINANCIAL STATEMENTS AND SUPPLEMENTARY DATA
INCOME STATEMENTS
(In millions, except per share amounts)
Y
ear Ended June 30, 2011 2010 2009
Revenue $ 69,943 $ 62,484 $ 58,437
Operating expenses:
Cost of revenue 15,577 12,395 12,155
Research and development 9,043 8,714 9,010
Sales and marketing 13,940 13,214 12,879
General and administrative 4,222 4,063 4,030
Total operating expenses 42,782 38,386 38,074
Operating income 27,161 24,098 20,363
Other income (expense) 910 915 (542)
Income before income taxes 28,071 25,013 19,821
Provision for income taxes 4,921 6,253 5,252
Net income $ 23,150 $ 18,760 $ 14,569
Earnings per share:
Basic $ 2.73 $ 2.13 $ 1.63
Diluted $ 2.69 $ 2.10 $ 1.62
Weighted average shares outstanding:
Basic 8,490 8,813 8,945
Diluted 8,593 8,927 8,996
Cash dividends declared per common share $ 0.64 $ 0.52 $ 0.52
See accompanying notes.