Microsoft 2011 Annual Report Download - page 29
Download and view the complete annual report
Please find page 29 of the 2011 Microsoft annual report below. You can navigate through the pages in the report by either clicking on the pages listed below, or by using the keyword search tool below to find specific information within the annual report.-
 1
1 -
2
-
3
-
4
-
5
-
6
-
7
-
8
-
9
-
10
-
11
-
12
-
13
-
14
-
15
-
16
-
17
-
18
-
 19
19 -
 20
20 -
 21
21 -
 22
22 -
 23
23 -
 24
24 -
 25
25 -
 26
26 -
 27
27 -
 28
28 -
 29
29 -
 30
30 -
 31
31 -
 32
32 -
 33
33 -
 34
34 -
 35
35 -
 36
36 -
 37
37 -
 38
38 -
 39
39 -
40
-
41
-
42
-
43
-
44
-
45
-
46
-
47
-
48
-
49
-
50
-
51
-
52
-
53
-
54
-
55
-
56
-
57
-
58
-
59
-
60
-
61
-
62
-
63
-
64
-
65
-
66
-
67
-
68
-
69
-
70
-
71
-
72
-
73
-
74
-
75
-
76
-
77
-
78
-
79
-
80
-
81
-
82
-
83
 |
 |

29
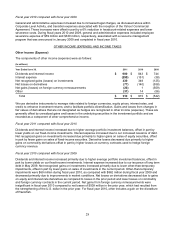
Income Taxes
Fiscal year 2011 compared with fiscal year 2010
Our effective tax rates for fiscal years 2011 and 2010 were approximately 18% and 25%, respectively. Our
effective tax rate was lower than the U.S. federal statutory rate and our prior year effective rate primarily due to a
higher mix of earnings taxed at lower rates in foreign jurisdictions resulting from producing and distributing our
products and services through our foreign regional operations centers in Ireland, Singapore, and Puerto Rico,
which are subject to lower income tax rates. In fiscal years 2011 and 2010, our U.S. income before income taxes
was $8.9 billion and $9.6 billion, respectively, and comprised 32% and 38%, respectively, of our income before
income taxes. In fiscal years 2011 and 2010, the foreign income before income taxes was $19.2 billion and $15.4
billion, respectively, and comprised 68% and 62%, respectively, of our income before income taxes. In fiscal
years 2011 and 2010, the reduction of the U.S. federal statutory rate as a result of foreign earnings taxed at lower
rates was 16% and 12%, respectively.
In addition, our effective tax rate was lower than in the prior year due to a partial settlement with the I.R.S. in the
third quarter of fiscal year 2011 relating to the audit of tax years 2004 to 2006. This partial settlement reduced our
income tax expense for fiscal year 2011 by $461 million.
Tax contingencies and other tax liabilities were $7.4 billion and $6.9 billion as of June 30, 2011 and 2010,
respectively, and are included in other long-term liabilities. We have not provided deferred U.S. income taxes or
foreign withholding taxes on temporary differences of approximately $44.8 billion resulting from earnings for
certain non-U.S. subsidiaries because they are permanently reinvested outside the U.S. The unrecognized
deferred tax liability associated with these temporary differences was approximately $14.2 billion as of June 30,
2011.
While we settled a portion of the I.R.S. audit for tax years 2004 to 2006 during the third quarter of fiscal year
2011, we remain under audit for these years. During the fourth quarter of fiscal year 2011, the I.R.S. completed its
examination and issued a Revenue Agent’s Report (“RAR”) for the remaining unresolved items. We do not agree
with the adjustments in the RAR, and we have filed a protest to initiate the administrative appeals process. The
proposed adjustments are primarily related to transfer pricing and could have a significant impact on our financial
statements if not resolved favorably; however, we believe our existing reserves are adequate. We do not believe it
is reasonably possible that the total amount of unrecognized tax benefits will significantly increase or decrease
within the next 12 months, as we do not believe the appeals process will be concluded within the next 12 months.
We also continue to be subject to examination by the I.R.S. for tax years 2007 to 2010.
Fiscal year 2010 compared with fiscal year 2009
Our effective tax rates in fiscal years 2010 and 2009 were approximately 25% and 27%, respectively. In fiscal
years 2010 and 2009, the reduction to the U.S. federal statutory rate as a result of foreign earnings taxed at lower
rates was 12% and 9%, respectively, reflecting the mix of U.S. and international income before income taxes and
the impact of changes in unrecognized tax benefits related to international income. In fiscal years 2010 and 2009,
foreign income before income taxes was $15.4 billion and $14.3 billion, respectively.
FINANCIAL CONDITION
Cash, Cash Equivalents, and Investments
Cash, cash equivalents, and short-term investments totaled $52.8 billion as of June 30, 2011, compared with
$36.8 billion as of June 30, 2010. Equity and other investments were $10.9 billion as of June 30, 2011, compared
with $7.8 billion as of June 30, 2010. Our short-term investments are primarily to facilitate liquidity and for capital
preservation. They consist predominantly of highly liquid investment-grade fixed-income securities, diversified
among industries and individual issuers. The investments are predominantly U.S. dollar-denominated securities,
but also include foreign currency-denominated securities in order to diversify risk. Our fixed-income investments
are exposed to interest rate risk and credit risk. The credit risk and average maturity of our fixed-income portfolio
are managed to achieve economic returns that correlate to certain fixed-income indices. The settlement risk
related to these investments is insignificant given that the short-term investments held are primarily highly liquid
investment-grade fixed-income securities. While we own certain mortgage-backed and asset-backed fixed-income
securities, our portfolio as of June 30, 2011 does not contain direct exposure to subprime mortgages or structured
vehicles that derive their value from subprime collateral. The majority of our mortgage-backed securities are
collateralized by prime residential mortgages and carry a 100% principal and interest guarantee, primarily from
Federal National Mortgage Association, Federal Home Loan Mortgage Corporation, and Government National
Mortgage Association.