Microsoft 2011 Annual Report Download - page 57
Download and view the complete annual report
Please find page 57 of the 2011 Microsoft annual report below. You can navigate through the pages in the report by either clicking on the pages listed below, or by using the keyword search tool below to find specific information within the annual report.-
 1
1 -
2
-
3
-
4
-
5
-
6
-
7
-
8
-
9
-
10
-
11
-
12
-
13
-
14
-
15
-
16
-
17
-
18
-
19
-
20
-
21
-
22
-
23
-
24
-
25
-
26
-
27
-
28
-
29
-
30
-
31
-
32
-
33
-
34
-
35
-
36
-
37
-
38
-
39
-
40
-
41
-
42
-
43
-
44
-
45
-
46
-
 47
47 -
 48
48 -
 49
49 -
 50
50 -
 51
51 -
 52
52 -
 53
53 -
 54
54 -
 55
55 -
 56
56 -
 57
57 -
 58
58 -
 59
59 -
 60
60 -
 61
61 -
 62
62 -
 63
63 -
 64
64 -
 65
65 -
 66
66 -
 67
67 -
68
-
69
-
70
-
71
-
72
-
73
-
74
-
75
-
76
-
77
-
78
-
79
-
80
-
81
-
82
-
83
 |
 |

57
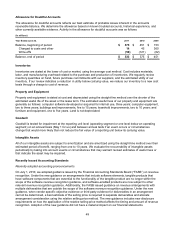
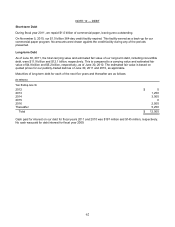
We estimate that $186 million of net derivative losses included in OCI at June 30, 2011 will be reclassified into
earnings within the following 12 months. No significant amounts of gains (losses) were reclassified from OCI into
earnings as a result of forecasted transactions that failed to occur during fiscal year 2011.
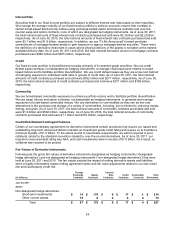
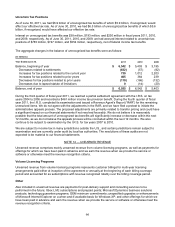
Non-Designated Derivative Gains (Losses)
Gains (losses) from changes in fair values of derivatives that are not designated as hedges are primarily
recognized in other income (expense). These amounts are shown in the table below, with the exception of gains
(losses) on derivatives presented in income statement line items other than other income (expense), which were
immaterial for all periods presented. Other than those derivatives entered into for investment purposes, such as
commodity contracts, the gains (losses) below are generally economically offset by unrealized gains (losses) in
the underlying available-for-sale securities.
(In millions)
Y
ear Ended June 30, 2011 2010 2009
Foreign exchange contracts $ (27) $ 106 $ (234)
Equity contracts 35 12 (131)
Interest-rate contracts 19 (4) 5
Credit contracts 24 22 (18)
Commodity contracts 148 (1) (126)
Total $ 199 $ 135 $ (504)
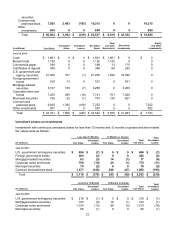
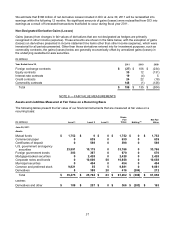
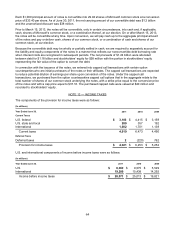
NOTE 6 — FAIR VALUE MEASUREMENTS
Assets and Liabilities Measured at Fair Value on a Recurring Basis
The following tables present the fair value of our financial instruments that are measured at fair value on a
recurring basis:
(In millions) Level 1 Level 2 Level 3
Gross
Fair
Value Netting (a) Net Fair
Value
June 30, 2011
Assets
Mutual funds $ 1,752 $ 0 $ 0 $ 1,752 $ 0 $ 1,752
Commercial paper 0 639 0 639 0 639
Certificates of deposit 0 598 0 598 0 598
U.S. government and agency
securities 23,591 10,175 0 33,766 0 33,766
Foreign government bonds 303 367 0 670 0 670
Mortgage-backed securities 0 2,428 0 2,428 0 2,428
Corporate notes and bonds 0 10,600 58 10,658 0 10,658
Municipal securities 0 454 0 454 0 454
Common and preferred stock 9,821 55 5 9,881 0 9,881
Derivatives 8 388 20 416 (204) 212
Total $ 35,475 $ 25,704 $ 83 $ 61,262 $ (204) $ 61,058
Liabilities
Derivatives and other $ 109 $ 257 $ 0 $ 366 $ (203) $ 163