Microsoft 2011 Annual Report Download - page 23
Download and view the complete annual report
Please find page 23 of the 2011 Microsoft annual report below. You can navigate through the pages in the report by either clicking on the pages listed below, or by using the keyword search tool below to find specific information within the annual report.-
 1
1 -
2
-
3
-
4
-
5
-
6
-
7
-
8
-
9
-
10
-
11
-
12
-
 13
13 -
 14
14 -
 15
15 -
 16
16 -
 17
17 -
 18
18 -
 19
19 -
 20
20 -
 21
21 -
 22
22 -
 23
23 -
 24
24 -
 25
25 -
 26
26 -
 27
27 -
 28
28 -
 29
29 -
 30
30 -
 31
31 -
 32
32 -
 33
33 -
34
-
35
-
36
-
37
-
38
-
39
-
40
-
41
-
42
-
43
-
44
-
45
-
46
-
47
-
48
-
49
-
50
-
51
-
52
-
53
-
54
-
55
-
56
-
57
-
58
-
59
-
60
-
61
-
62
-
63
-
64
-
65
-
66
-
67
-
68
-
69
-
70
-
71
-
72
-
73
-
74
-
75
-
76
-
77
-
78
-
79
-
80
-
81
-
82
-
83
 |
 |

23
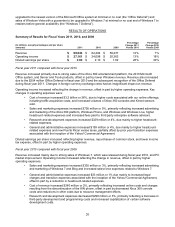
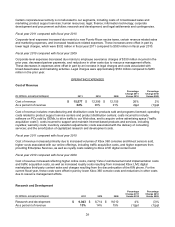
Fiscal year 2011 compared with fiscal year 2010
Server and Tools revenue increased reflecting growth in both product sales and Enterprise Services. Product
revenue increased $1.4 billion or 11%, driven primarily by growth in Windows Server, SQL Server, Enterprise
CAL Suites, and Windows Embedded, reflecting continued adoption of Windows platform applications. Enterprise
Services revenue grew $337 million or 11%, due to growth in both Premier product support and consulting
services.
Server and Tools operating income increased due to revenue growth, offset in part by higher operating expenses.
Cost of revenue increased $366 million or 13%, primarily reflecting a $323 million increase in expenses from
providing Enterprise Services. Sales and marketing expenses increased $264 million or 6% reflecting increased
fees paid to third party enterprise software advisors and increased corporate marketing activities.
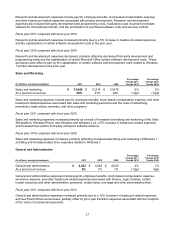
Fiscal year 2010 compared with fiscal year 2009
Server and Tools revenue increased mainly reflecting growth in product revenue. Product revenue increased
$784 million or 7%, driven primarily by growth in Windows Server, SQL Server and Enterprise CAL Suites
revenue, reflecting increased revenue from annuity volume licensing agreements and continued adoption of
Windows platform applications, offset in part by a decline in developer tools revenue. Enterprise Services revenue
was relatively flat, with growth in Premier product support services nearly offset by decreased consulting services.
Server and Tools operating income increased due mainly to revenue growth, offset in part by increased cost of
revenue. Cost of revenue increased $65 million or 2%, reflecting increased headcount-related expenses and
hosting costs.
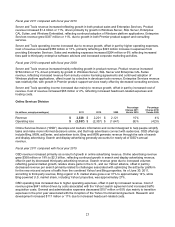
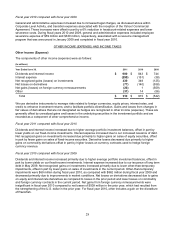
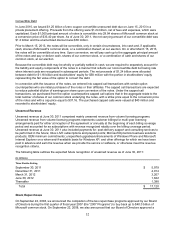
Online Services Division
(In millions, except percentages) 2011 2010 2009
Percentage
Change 2011
Versus 2010
Percentage
Change 2010
Versus 2009
Revenue $ 2,528 $ 2,201 $ 2,121 15% 4%
Operating loss $ (2,557) $ (2,337) $ (1,641) (9)% (42)%
Online Services Division (“OSD”) develops and markets information and content designed to help people simplify
tasks and make more informed decisions online, and that help advertisers connect with audiences. OSD offerings
include Bing, MSN, adCenter, and advertiser tools. Bing and MSN generate revenue through the sale of search
and display advertising. Search and display advertising generally accounts for nearly all of OSD’s annual
revenue.
Fiscal year 2011 compared with fiscal year 2010
OSD revenue increased primarily as a result of growth in online advertising revenue. Online advertising revenue
grew $358 million or 19% to $2.3 billion, reflecting continued growth in search and display advertising revenue,
offset in part by decreased third party advertising revenue. Search revenue grew due to increased volumes
reflecting general market growth, relative share gains in the U.S., and our Yahoo! alliance, offset in part by
decreased revenue per search primarily related to challenges associated with optimizing the adCenter platform
for the new mix and volume of traffic from the combined Yahoo! and Bing properties. As of June 30, 2011,
according to third-party sources, Bing organic U.S. market share grew over 31% to approximately 14%, while
Bing-powered U.S. market share, including Yahoo! properties, was approximately 27%.
OSD operating loss increased due to higher operating expenses, offset in part by increased revenue. Cost of
revenue grew $641 million driven by costs associated with the Yahoo! search agreement and increased traffic
acquisition costs. General and administrative expenses decreased $157 million or 60% due mainly to transition
expenses in the prior year associated with the inception of the Yahoo! Commercial Agreement. Research and
development increased $117 million or 11% due to increased headcount-related costs.