Microsoft 2011 Annual Report Download - page 59
Download and view the complete annual report
Please find page 59 of the 2011 Microsoft annual report below. You can navigate through the pages in the report by either clicking on the pages listed below, or by using the keyword search tool below to find specific information within the annual report.-
 1
1 -
2
-
3
-
4
-
5
-
6
-
7
-
8
-
9
-
10
-
11
-
12
-
13
-
14
-
15
-
16
-
17
-
18
-
19
-
20
-
21
-
22
-
23
-
24
-
25
-
26
-
27
-
28
-
29
-
30
-
31
-
32
-
33
-
34
-
35
-
36
-
37
-
38
-
39
-
40
-
41
-
42
-
43
-
44
-
45
-
46
-
47
-
48
-
 49
49 -
 50
50 -
 51
51 -
 52
52 -
 53
53 -
 54
54 -
 55
55 -
 56
56 -
 57
57 -
 58
58 -
 59
59 -
 60
60 -
 61
61 -
 62
62 -
 63
63 -
 64
64 -
 65
65 -
 66
66 -
 67
67 -
 68
68 -
 69
69 -
70
-
71
-
72
-
73
-
74
-
75
-
76
-
77
-
78
-
79
-
80
-
81
-
82
-
83
 |
 |

59
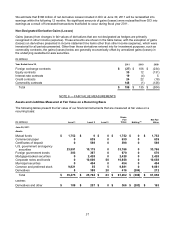
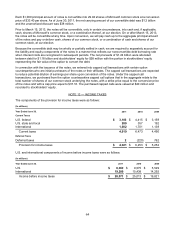
Change in unrealized gains (losses) included in other income
(expense) related to assets held as of June 30, 2011 $ 6 $ 0 $ 11 $ 17
(In millions)
Corporate
Notes and
Bonds
Common
and
Preferred
Stock Derivative
Assets Total
Y
ear Ended June 30, 2010
Balance, beginning of period $ 253 $ 5 $ 5 $ 263
Total realized and unrealized gains (losses):
Included in other income (expense) 6 0 4 10
Included in other comprehensive income (92) 0 0 (92)
Balance, end of period $ 167 $ 5 $ 9 $ 181
Change in unrealized gains (losses) included in other income
(expense) related to assets held as of June 30, 2010 $ 6 $ 0 $ 4 $ 10
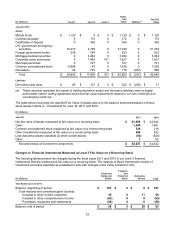
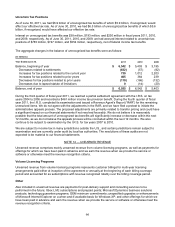
Assets and Liabilities Measured at Fair Value on a Nonrecurring Basis
During fiscal years 2011 and 2010, impairment charges of $2 million and $5 million, respectively, were recognized
for certain investments measured at fair value on a nonrecurring basis, as the decline in their respective fair
values below their cost was determined to be other than temporary in all instances. At June 30, 2011 and 2010,
we held no common and preferred stocks that were required to be measured at fair value on a nonrecurring basis.
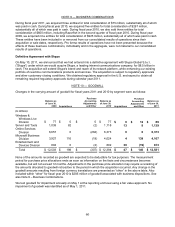
NOTE 7 — INVENTORIES
The components of inventories were as follows:
(In millions)
June 30, 2011 2010
Raw materials $ 232
$ 172
Work in process 56
16
Finished goods 1,084
552
Total $ 1,372 $ 740
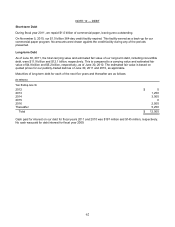
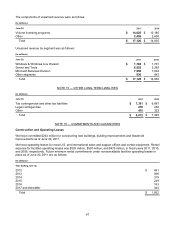
NOTE 8 — PROPERTY AND EQUIPMENT
The components of property and equipment were as follows:
(In millions)
June 30, 2011 2010
Land $ 533
$ 526
Buildings and improvements 6,521
6,087
Leasehold improvements 2,345
2,100
Computer equipment and software 6,601
5,673
Furniture and equipment 1,991
1,873
Total, at cost 17,991 16,259
Accumulated depreciation (9,829) (8,629)
Total, net $ 8,162
$ 7,630
During fiscal years 2011, 2010, and 2009, depreciation expense was $2.0 billion, $1.8 billion, and $1.7 billion,
respectively.