LensCrafters 2015 Annual Report Download - page 8
Download and view the complete annual report
Please find page 8 of the 2015 LensCrafters annual report below. You can navigate through the pages in the report by either clicking on the pages listed below, or by using the keyword search tool below to find specific information within the annual report.-
 1
1 -
 2
2 -
 3
3 -
 4
4 -
 5
5 -
 6
6 -
 7
7 -
 8
8 -
 9
9 -
 10
10 -
 11
11 -
 12
12 -
 13
13 -
 14
14 -
 15
15 -
 16
16 -
 17
17 -
 18
18 -
 19
19 -
20
-
21
-
22
-
23
-
24
-
25
-
26
-
27
-
28
-
29
-
30
-
31
-
32
-
33
-
34
-
35
-
36
-
37
-
38
-
39
-
40
-
41
-
42
-
43
-
44
-
45
-
46
-
47
-
48
-
49
-
50
-
51
-
52
-
53
-
54
-
55
-
56
-
57
-
58
-
59
-
60
-
61
-
62
-
63
-
64
-
65
-
66
-
67
-
68
-
69
-
70
-
71
-
72
-
73
-
74
-
75
-
76
-
77
-
78
-
79
-
80
-
81
-
82
-
83
-
84
-
85
-
86
-
87
-
88
-
89
-
90
-
91
-
92
-
93
-
94
-
95
-
96
-
97
-
98
-
99
-
100
-
101
-
102
-
103
-
104
-
105
-
106
-
107
-
108
-
109
-
110
-
111
-
112
-
113
-
114
-
115
-
116
-
117
-
118
-
119
-
120
-
121
-
122
-
123
-
124
-
125
-
126
-
127
-
128
-
129
-
130
-
131
-
132
-
133
-
134
-
135
-
136
-
137
-
138
-
139
-
140
-
141
-
142
-
143
-
144
-
145
-
146
-
147
-
148
-
149
-
150
-
151
-
152
-
153
-
154
-
155
-
156
-
157
-
158
-
159
-
160
-
161
-
162
-
163
-
164
-
165
-
166
-
167
-
168
-
169
-
170
-
171
-
172
-
173
-
174
-
175
-
176
-
177
-
178
-
179
-
180
-
181
-
182
-
183
-
184
-
185
-
186
-
187
-
188
-
189
-
190
-
191
-
192
-
193
-
194
-
195
-
196
-
197
-
198
-
199
-
200
-
201
-
202
-
203
-
204
-
205
-
206
-
207
-
208
-
209
-
210
-
211
-
212
-
213
-
214
-
215
-
216
-
217
-
218
-
219
-
220
-
221
-
222
-
223
-
224
-
225
-
226
-
227
-
228
-
229
-
230
-
231
-
232
-
233
-
234
-
235
-
236
-
237
-
238
-
239
-
240
-
241
-
242
-
243
-
244
-
245
-
246
-
247
-
248
-
249
-
250
-
251
-
252
-
253
-
254
-
255
-
256
-
257
-
258
-
259
-
260
-
261
-
262
-
263
-
264
-
265
-
266
-
267
-
268
-
269
-
270
 |
 |

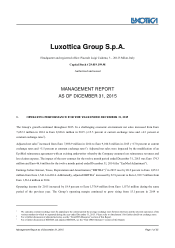
Management Report as of December 31, 2015 Page 4 of 35
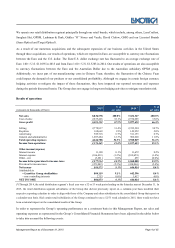
We operate our retail distribution segment principally through our retail brands, which include, among others, LensCrafters,
Sunglass Hut, OPSM, Laubman & Pank, Oakley “O” Stores and Vaults, David Clulow, GMO and our Licensed Brands
(Sears Optical and Target Optical).
As a result of our numerous acquisitions and the subsequent expansion of our business activities in the United States
through these acquisitions, our results of operations, which are reported in Euro, are susceptible to currency rate fluctuations
between the Euro and the U.S. dollar. The Euro/U.S. dollar exchange rate has fluctuated to an average exchange rate of
Euro 1.00 = U.S. $1.1095 in 2015 and from Euro 1.00 = U.S. $1.3285 in 2014. Our results of operations are also susceptible
to currency fluctuations between the Euro and the Australian Dollar due to the Australian subsidiary OPSM group.
Additionally, we incur part of our manufacturing costs in Chinese Yuan; therefore, the fluctuation of the Chinese Yuan
could impact the demand of our products or our consolidated profitability. Although we engage in certain foreign currency
hedging activities to mitigate the impact of these fluctuations, they have impacted our reported revenues and expenses
during the periods discussed herein. The Group does not engage in long-term hedging activities to mitigate translation risk.
Results of operations
(Amounts in thousands of Euro) 2015
% of
net sales
2014 (*)
% of
net sales
Net sales
8,836,578
100.0%
7,652,317
100.0%
Cost of sales 2,835,426
32.1%
2,574,685
33.6%
Gross profit 6,001,152
67.9%
5,077,632
66.4%
Selling 2,778,837
31.4%
2,352,294
30.7%
Royalties
168,669
1.9%
149,952
2.0%
Advertising 589,718
6.7%
511,153
6.7%
General and administrative 1,087,484
12.3%
906,620
11.8%
Total operating expenses 4,624,708
52.3%
3,920,019
51.2%
Income from operations 1,376,445
15.6%
1,157,613
15.1%
Other income/(expense)
Interest income 11,190
0.1%
11,672
0.2%
Interest expense (106,439)
(1.2%)
(109,659)
(1.4%)
Other—net (3,281)
0.0%
455
(0.0%)
Income before provision for income taxes 1,277,914
14.5%
1,060,080
13.9%
Provision for income taxes (471,042)
(5.3%)
(414,066)
(5.4%)
Net income 806,873
9.1%
646,014
8.4%
Attributable to
—
Luxottica Group stockholders
804,119
9.1%
642,596
8.4
%
—non-controlling interests 2,753
0.0%
3,417
0.0%
NET INCOME 806,873
9.1%
646,014
8.4%
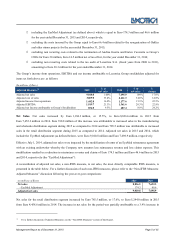
(*)Through 2014, the retail distribution segment’s fiscal year was a 52 or 53 week period ending on the Saturday nearest December 31. In
2015, the retail distribution segment subsidiaries of the Group that did not previously report on a calendar-year basis modified their
respective reporting calendars in order to align with those of the Company and other subsidiaries in the consolidated Group that report on
a calendar-year basis. Had certain retail subsidiaries of the Group continued to use a 52/53 week calendar in 2015, there would not have
been a material impact on the consolidated results of the Group.
In order to represent the Group’s operating performance on a consistent basis in this Management Report, net sales and
operating expenses as represented in the Group’s Consolidated Financial Statements have been adjusted in the tables below
to take into account the following events: