LensCrafters 2015 Annual Report Download - page 35
Download and view the complete annual report
Please find page 35 of the 2015 LensCrafters annual report below. You can navigate through the pages in the report by either clicking on the pages listed below, or by using the keyword search tool below to find specific information within the annual report.-
 1
1 -
2
-
3
-
4
-
5
-
6
-
7
-
8
-
9
-
10
-
11
-
12
-
13
-
14
-
15
-
16
-
17
-
18
-
19
-
20
-
21
-
22
-
23
-
24
-
 25
25 -
 26
26 -
 27
27 -
 28
28 -
 29
29 -
 30
30 -
 31
31 -
 32
32 -
 33
33 -
 34
34 -
 35
35 -
 36
36 -
 37
37 -
 38
38 -
 39
39 -
 40
40 -
 41
41 -
 42
42 -
 43
43 -
 44
44 -
 45
45 -
46
-
47
-
48
-
49
-
50
-
51
-
52
-
53
-
54
-
55
-
56
-
57
-
58
-
59
-
60
-
61
-
62
-
63
-
64
-
65
-
66
-
67
-
68
-
69
-
70
-
71
-
72
-
73
-
74
-
75
-
76
-
77
-
78
-
79
-
80
-
81
-
82
-
83
-
84
-
85
-
86
-
87
-
88
-
89
-
90
-
91
-
92
-
93
-
94
-
95
-
96
-
97
-
98
-
99
-
100
-
101
-
102
-
103
-
104
-
105
-
106
-
107
-
108
-
109
-
110
-
111
-
112
-
113
-
114
-
115
-
116
-
117
-
118
-
119
-
120
-
121
-
122
-
123
-
124
-
125
-
126
-
127
-
128
-
129
-
130
-
131
-
132
-
133
-
134
-
135
-
136
-
137
-
138
-
139
-
140
-
141
-
142
-
143
-
144
-
145
-
146
-
147
-
148
-
149
-
150
-
151
-
152
-
153
-
154
-
155
-
156
-
157
-
158
-
159
-
160
-
161
-
162
-
163
-
164
-
165
-
166
-
167
-
168
-
169
-
170
-
171
-
172
-
173
-
174
-
175
-
176
-
177
-
178
-
179
-
180
-
181
-
182
-
183
-
184
-
185
-
186
-
187
-
188
-
189
-
190
-
191
-
192
-
193
-
194
-
195
-
196
-
197
-
198
-
199
-
200
-
201
-
202
-
203
-
204
-
205
-
206
-
207
-
208
-
209
-
210
-
211
-
212
-
213
-
214
-
215
-
216
-
217
-
218
-
219
-
220
-
221
-
222
-
223
-
224
-
225
-
226
-
227
-
228
-
229
-
230
-
231
-
232
-
233
-
234
-
235
-
236
-
237
-
238
-
239
-
240
-
241
-
242
-
243
-
244
-
245
-
246
-
247
-
248
-
249
-
250
-
251
-
252
-
253
-
254
-
255
-
256
-
257
-
258
-
259
-
260
-
261
-
262
-
263
-
264
-
265
-
266
-
267
-
268
-
269
-
270
 |
 |

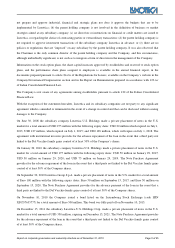
Management Report as of December 31, 2015 Page 31 of 35
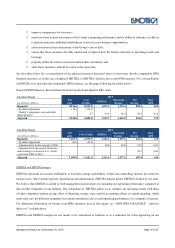
financial statements prepared in accordance with IFRS. Rather, these non-IFRS measures should be used as a supplement to
IFRS results to assist the reader in better understanding the operational performance of the Group.
The Group cautions that these measures are not defined terms under IFRS and their definitions should be carefully reviewed
and understood by investors.
Investors should be aware that our method of calculating EBITDA may differ from methods used by other companies. We
recognize that the usefulness of EBITDA has certain limitations, including:
1 EBITDA does not include interest expense. Because we have borrowed money in order to finance our
operations, interest expense is a necessary element of our costs and ability to generate profits and cash flows.
Therefore, any measure that excludes interest expense may have material limitations;
1 EBITDA does not include depreciation and amortization expense. Because we use capital assets, depreciation
and amortization expense is a necessary element of our costs and ability to generate profits. Therefore, any
measure that excludes depreciation and amortization expense may have material limitations;
1 EBITDA does not include provision for income taxes. Because the payment of income taxes is a necessary
element of our costs, any measure that excludes tax expense may have material limitations;
1 EBITDA does not reflect cash expenditures or future requirements for capital expenditures or contractual
commitments;
1 EBITDA does not reflect changes in, or cash requirements for, working capital needs;
1 EBITDA does not allow us to analyze the effect of certain recurring and non-recurring items that materially
affect our net income or loss.
We compensate for the foregoing limitations by using EBITDA as a comparative tool, together with IFRS measurements, to
assist in the evaluation of our operating performance and leverage. The following table provides a reconciliation of
EBITDA to net income, which is the most directly comparable IFRS financial measure, as well as the calculation of
EBITDA margin on net sales:
(in millions of Euro) 2015
2014
Net income/(loss) (+) 804.1
642.6
Net income attributable to non-controlling interest (+) 2.8
3.4
Provision for income taxes (+) 471.0
414.1
Other (income)/expense (+) 98.5
97.5
Depreciation and amortization (+) 476.9
384.0
EBITDA (=) 1,853.3
1,541.6
Net sales (/) 8,836.6
7,652.3
EBITDA margin (=) 21.0%
20.1%
Non-IAS/IFRS Measure: Adjusted EBITDA and Adjusted EBITDA margin
(in millions of Euro) FY 2015
(1,4)
FY 2014
(1,2,3)
Adjusted net income/(loss) (+) 854.0
687.4
Net income attributable to non-controlling interest (+) 2.8
3.4
Adjusted provision for income taxes (+) 487.6
389.2
Other (income)/expense (+) 98.5
97.5
Depreciation and amortization (+) 476.9
384.0
Adjusted EBITDA (=) 1,919.7
1,561.6
Net sales (/) 9,010.8
7,698.9