LensCrafters 2015 Annual Report Download - page 18
Download and view the complete annual report
Please find page 18 of the 2015 LensCrafters annual report below. You can navigate through the pages in the report by either clicking on the pages listed below, or by using the keyword search tool below to find specific information within the annual report.-
 1
1 -
2
-
3
-
4
-
5
-
6
-
7
-
 8
8 -
 9
9 -
 10
10 -
 11
11 -
 12
12 -
 13
13 -
 14
14 -
 15
15 -
 16
16 -
 17
17 -
 18
18 -
 19
19 -
 20
20 -
 21
21 -
 22
22 -
 23
23 -
 24
24 -
 25
25 -
 26
26 -
 27
27 -
 28
28 -
29
-
30
-
31
-
32
-
33
-
34
-
35
-
36
-
37
-
38
-
39
-
40
-
41
-
42
-
43
-
44
-
45
-
46
-
47
-
48
-
49
-
50
-
51
-
52
-
53
-
54
-
55
-
56
-
57
-
58
-
59
-
60
-
61
-
62
-
63
-
64
-
65
-
66
-
67
-
68
-
69
-
70
-
71
-
72
-
73
-
74
-
75
-
76
-
77
-
78
-
79
-
80
-
81
-
82
-
83
-
84
-
85
-
86
-
87
-
88
-
89
-
90
-
91
-
92
-
93
-
94
-
95
-
96
-
97
-
98
-
99
-
100
-
101
-
102
-
103
-
104
-
105
-
106
-
107
-
108
-
109
-
110
-
111
-
112
-
113
-
114
-
115
-
116
-
117
-
118
-
119
-
120
-
121
-
122
-
123
-
124
-
125
-
126
-
127
-
128
-
129
-
130
-
131
-
132
-
133
-
134
-
135
-
136
-
137
-
138
-
139
-
140
-
141
-
142
-
143
-
144
-
145
-
146
-
147
-
148
-
149
-
150
-
151
-
152
-
153
-
154
-
155
-
156
-
157
-
158
-
159
-
160
-
161
-
162
-
163
-
164
-
165
-
166
-
167
-
168
-
169
-
170
-
171
-
172
-
173
-
174
-
175
-
176
-
177
-
178
-
179
-
180
-
181
-
182
-
183
-
184
-
185
-
186
-
187
-
188
-
189
-
190
-
191
-
192
-
193
-
194
-
195
-
196
-
197
-
198
-
199
-
200
-
201
-
202
-
203
-
204
-
205
-
206
-
207
-
208
-
209
-
210
-
211
-
212
-
213
-
214
-
215
-
216
-
217
-
218
-
219
-
220
-
221
-
222
-
223
-
224
-
225
-
226
-
227
-
228
-
229
-
230
-
231
-
232
-
233
-
234
-
235
-
236
-
237
-
238
-
239
-
240
-
241
-
242
-
243
-
244
-
245
-
246
-
247
-
248
-
249
-
250
-
251
-
252
-
253
-
254
-
255
-
256
-
257
-
258
-
259
-
260
-
261
-
262
-
263
-
264
-
265
-
266
-
267
-
268
-
269
-
270
 |
 |
Management Report as of December 31, 2015 Page 14 of 35
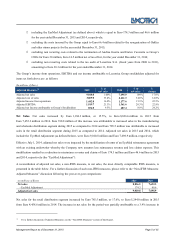
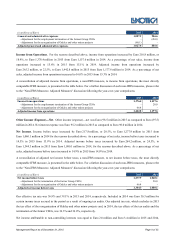
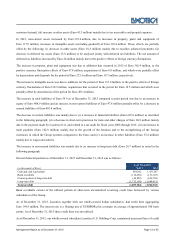
with an aggregate maximum availability of Euro 119.4 million (USD 130.0 million converted at applicable exchange rate
for the period ended December 31, 2015). The interest is at a floating rate of approximately LIBOR plus 50 basis points. As
of December 31, 2015 these credit lines were not utilized. At December 31, 2015 there was Euro 45.2 million in aggregate
face amount of stand-by letters of credit outstanding related to guarantees on these lines of credit.
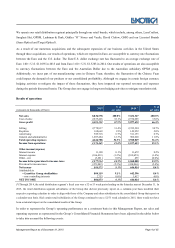
As of December 31, 2015 the aggregate of current and non-current long-term debt compared to December 31, 2014
decreased by Euro 555,2 million mainly due to the repayment of two private placements amounting to Euro 500 million and
Euro 114.4 million (USD 127 million), respectively. This effect is partially offset by the positive effects of foreign currency
fluctuations (Euro 76.9 million) and 2015 issuances (Euro 14.4 million).
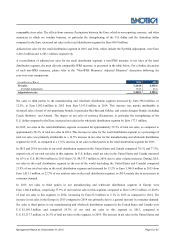
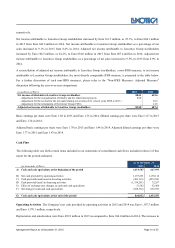
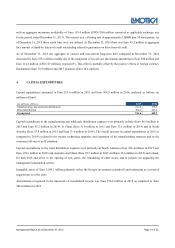
4. CAPITAL EXPENDITURES
Capital expenditures amounted to Euro 513.6 million in 2015 and Euro 418.9 million in 2014, analyzed as follows (in
millions of Euro):
(in millions of Euro)
2015
2014
Manufacturing and wholesale distribution 211.0
175.6
Retail distribution 302.6
243.4
Group total
513
.
6
418
.
9
Capital expenditures in the manufacturing and wholesale distribution segment were primarily in Italy (Euro 86.9 million in
2015 and Euro 95.2 million in 2014), in China (Euro 51.0 million in 2015 and Euro 35.1 million in 2014) and in North
America (Euro 53.8 million in 2015 and Euro 31.4 million in 2014). The overall increase in capital expenditures in 2015 as
compared to 2014 is related to the routine technology upgrades and expansion of the manufacturing structure and to the
continued roll-out of an IT platform.
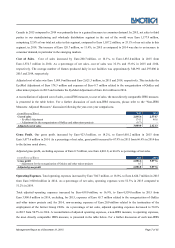
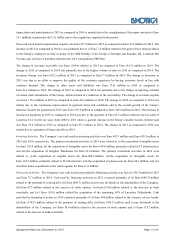
Capital expenditures in the retail distribution segment were primarily in North America (Euro 236.4 million in 2015 and
Euro 178.6 million in 2014) and Australia and China (Euro 29.2 million in 2015 and Euro 32.6 million in 2014) and related,
for both 2015 and 2014, to the opening of new stores, the remodeling of older stores, and to projects for upgrading the
management information system.
Intangible assets of Euro 5,039.1 million primarily reflect the Group's investment in goodwill and trademarks as a result of
acquisitions over the years.
Amortization recognized in the statement of consolidated income was Euro 476.9 million in 2015 as compared to Euro
384.0 million in 2014.