LensCrafters 2015 Annual Report Download - page 10
Download and view the complete annual report
Please find page 10 of the 2015 LensCrafters annual report below. You can navigate through the pages in the report by either clicking on the pages listed below, or by using the keyword search tool below to find specific information within the annual report.-
 1
1 -
 2
2 -
 3
3 -
 4
4 -
 5
5 -
 6
6 -
 7
7 -
 8
8 -
 9
9 -
 10
10 -
 11
11 -
 12
12 -
 13
13 -
 14
14 -
 15
15 -
 16
16 -
 17
17 -
 18
18 -
 19
19 -
 20
20 -
 21
21 -
22
-
23
-
24
-
25
-
26
-
27
-
28
-
29
-
30
-
31
-
32
-
33
-
34
-
35
-
36
-
37
-
38
-
39
-
40
-
41
-
42
-
43
-
44
-
45
-
46
-
47
-
48
-
49
-
50
-
51
-
52
-
53
-
54
-
55
-
56
-
57
-
58
-
59
-
60
-
61
-
62
-
63
-
64
-
65
-
66
-
67
-
68
-
69
-
70
-
71
-
72
-
73
-
74
-
75
-
76
-
77
-
78
-
79
-
80
-
81
-
82
-
83
-
84
-
85
-
86
-
87
-
88
-
89
-
90
-
91
-
92
-
93
-
94
-
95
-
96
-
97
-
98
-
99
-
100
-
101
-
102
-
103
-
104
-
105
-
106
-
107
-
108
-
109
-
110
-
111
-
112
-
113
-
114
-
115
-
116
-
117
-
118
-
119
-
120
-
121
-
122
-
123
-
124
-
125
-
126
-
127
-
128
-
129
-
130
-
131
-
132
-
133
-
134
-
135
-
136
-
137
-
138
-
139
-
140
-
141
-
142
-
143
-
144
-
145
-
146
-
147
-
148
-
149
-
150
-
151
-
152
-
153
-
154
-
155
-
156
-
157
-
158
-
159
-
160
-
161
-
162
-
163
-
164
-
165
-
166
-
167
-
168
-
169
-
170
-
171
-
172
-
173
-
174
-
175
-
176
-
177
-
178
-
179
-
180
-
181
-
182
-
183
-
184
-
185
-
186
-
187
-
188
-
189
-
190
-
191
-
192
-
193
-
194
-
195
-
196
-
197
-
198
-
199
-
200
-
201
-
202
-
203
-
204
-
205
-
206
-
207
-
208
-
209
-
210
-
211
-
212
-
213
-
214
-
215
-
216
-
217
-
218
-
219
-
220
-
221
-
222
-
223
-
224
-
225
-
226
-
227
-
228
-
229
-
230
-
231
-
232
-
233
-
234
-
235
-
236
-
237
-
238
-
239
-
240
-
241
-
242
-
243
-
244
-
245
-
246
-
247
-
248
-
249
-
250
-
251
-
252
-
253
-
254
-
255
-
256
-
257
-
258
-
259
-
260
-
261
-
262
-
263
-
264
-
265
-
266
-
267
-
268
-
269
-
270
 |
 |
Management Report as of December 31, 2015 Page 6 of 35
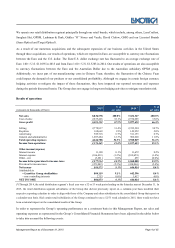
comparable store sales. The effects from currency fluctuations between the Euro, which is our reporting currency, and other
currencies in which we conduct business, in particular the strengthening of the U.S. dollar and the Australian dollar
compared to the Euro, increased net sales in the retail distribution segment by Euro 680.9 million.
Adjusted net sales for the retail distribution segment in 2015 and 2014, which include the EyeMed Adjustment, were Euro
5,418.3 million and 4,505.1 million, respectively.
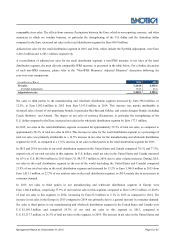
A reconciliation of adjusted net sales for the retail distribution segment, a non-IFRS measure, to net sales of the retail
distribution segment, the most directly comparable IFRS measure, is presented in the table below. For a further discussion
of such non-IFRS measures, please refer to the “Non-IFRS Measures: Adjusted Measures” discussion following the
year-over-year comparisons:
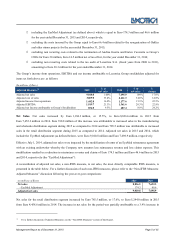
(in millions of Euro) 2015
2014
Net sales 5,244.0
4,458.6
- EyeMed Adjustment 174.3
46.6
Adjusted net sales 5,418.3
4,505.1
Net sales to third parties in the manufacturing and wholesale distribution segment increased by Euro 398.8 million, or
12.5%, to Euro 3,592.6 million in 2015 from Euro 3,193.8 million in 2014. This increase was mainly attributable to
increased sales of most of our proprietary brands, in particular Ray-Ban and Oakley, and certain designer brands, including
Coach, Burberry and Armani. The impact on net sales of currency fluctuations, in particular the strengthening of the
U.S. dollar compared to the Euro, increased net sales in the wholesale distribution segment by Euro 177.1 million.
In 2015, net sales in the retail distribution segment accounted for approximately 59.3% of total net sales, as compared to
approximately 58.3% of total net sales in 2014. This increase in sales for the retail distribution segment as a percentage of
total net sales was primarily attributable to a 12.5% increase in net sales for the manufacturing and wholesale distribution
segment for 2015, as compared to a 17.6% increase in net sales to third parties in the retail distribution segment for 2015.
In 2015 and 2014, net sales in our retail distribution segment in the United States and Canada comprised 78.1% and 77.3%,
respectively, of our total net sales in this segment. In U.S. dollars, retail net sales in the United States and Canada increased
by 0.3% to U.S. $4,590.8 million in 2015 from U.S. $4,577.3 million in 2014, due to sales volume increases. During 2015,
net sales in the retail distribution segment in the rest of the world (excluding the United States and Canada) comprised
21.9% of our total net sales in the retail distribution segment and increased by 13.2% to Euro 1,146.8 million in 2015 from
Euro 1,013.1 million, or 22.7% of our total net sales in the retail distribution segment, in 2014, mainly due to an increase in
consumer demand.
In 2015, net sales to third parties in our manufacturing and wholesale distribution segment in Europe were
Euro 1,360.8 million, comprising 37.9% of our total net sales in this segment, compared to Euro 1,295.3 million, or 40.6%
of total net sales in this segment, in 2014, increasing by Euro 65.5 million or 5.1% in 2015 as compared to 2014. The
increase in net sales in the Europe in 2015 compared to 2014 was primarily due to a general increase in consumer demand.
Net sales to third parties in our manufacturing and wholesale distribution segment in the United States and Canada were
U.S. $1,169.3 million and comprised 29.3% of our total net sales in this segment in 2015, compared to
U.S. $1,117.7 million, or 26.3% of total net sales in this segment, in 2014. The increase in net sales in the United States and