LensCrafters 2015 Annual Report Download - page 12
Download and view the complete annual report
Please find page 12 of the 2015 LensCrafters annual report below. You can navigate through the pages in the report by either clicking on the pages listed below, or by using the keyword search tool below to find specific information within the annual report.-
 1
1 -
 2
2 -
 3
3 -
 4
4 -
 5
5 -
 6
6 -
 7
7 -
 8
8 -
 9
9 -
 10
10 -
 11
11 -
 12
12 -
 13
13 -
 14
14 -
 15
15 -
 16
16 -
 17
17 -
 18
18 -
 19
19 -
 20
20 -
 21
21 -
 22
22 -
23
-
24
-
25
-
26
-
27
-
28
-
29
-
30
-
31
-
32
-
33
-
34
-
35
-
36
-
37
-
38
-
39
-
40
-
41
-
42
-
43
-
44
-
45
-
46
-
47
-
48
-
49
-
50
-
51
-
52
-
53
-
54
-
55
-
56
-
57
-
58
-
59
-
60
-
61
-
62
-
63
-
64
-
65
-
66
-
67
-
68
-
69
-
70
-
71
-
72
-
73
-
74
-
75
-
76
-
77
-
78
-
79
-
80
-
81
-
82
-
83
-
84
-
85
-
86
-
87
-
88
-
89
-
90
-
91
-
92
-
93
-
94
-
95
-
96
-
97
-
98
-
99
-
100
-
101
-
102
-
103
-
104
-
105
-
106
-
107
-
108
-
109
-
110
-
111
-
112
-
113
-
114
-
115
-
116
-
117
-
118
-
119
-
120
-
121
-
122
-
123
-
124
-
125
-
126
-
127
-
128
-
129
-
130
-
131
-
132
-
133
-
134
-
135
-
136
-
137
-
138
-
139
-
140
-
141
-
142
-
143
-
144
-
145
-
146
-
147
-
148
-
149
-
150
-
151
-
152
-
153
-
154
-
155
-
156
-
157
-
158
-
159
-
160
-
161
-
162
-
163
-
164
-
165
-
166
-
167
-
168
-
169
-
170
-
171
-
172
-
173
-
174
-
175
-
176
-
177
-
178
-
179
-
180
-
181
-
182
-
183
-
184
-
185
-
186
-
187
-
188
-
189
-
190
-
191
-
192
-
193
-
194
-
195
-
196
-
197
-
198
-
199
-
200
-
201
-
202
-
203
-
204
-
205
-
206
-
207
-
208
-
209
-
210
-
211
-
212
-
213
-
214
-
215
-
216
-
217
-
218
-
219
-
220
-
221
-
222
-
223
-
224
-
225
-
226
-
227
-
228
-
229
-
230
-
231
-
232
-
233
-
234
-
235
-
236
-
237
-
238
-
239
-
240
-
241
-
242
-
243
-
244
-
245
-
246
-
247
-
248
-
249
-
250
-
251
-
252
-
253
-
254
-
255
-
256
-
257
-
258
-
259
-
260
-
261
-
262
-
263
-
264
-
265
-
266
-
267
-
268
-
269
-
270
 |
 |
Management Report as of December 31, 2015 Page 8 of 35
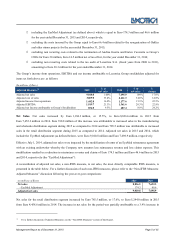
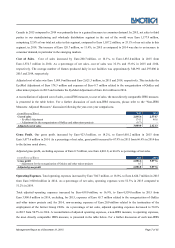
measures, please refer to the “Non-IFRS Measures: Adjusted Measures” discussion following the year-over-year
comparisons.
(in millions of Euro) 2015
2014
Operating expenses 4,624.7
3,920.0
- Adjustment for the employment termination of the former Group CEOs -
(20.0)
- Adjustment for the reorganization of Oakley and other minor projects (65.7)
-
Adjusted operating expenses 4,559.0
3,900.0
Selling and advertising expenses (including royalty expenses) increased by Euro 523.8 million, or 17.4%, to
Euro 3,537.2 million in 2015 from Euro 3,013.4 million in 2014. Selling expenses increased by Euro 426.5 million, or
18.1% to Euro 2,778.8 million in 2015 from Euro 2,352.3 million in 2014. As a percentage of net sales, selling expenses
were 31.4% and 30.7% in 2015 and 2014, respectively. Advertising expenses increased by Euro 78.6 million, or 15.4%. As
a percentage of net sales, advertising expenses were 6.7% in both 2015 and 2014. Royalties increased by Euro 18.7 million,
or 12.5%. As a percentage of net sales, royalty expenses were 1.9% and 2.0% in 2015 and 2014, respectively.
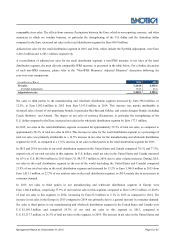
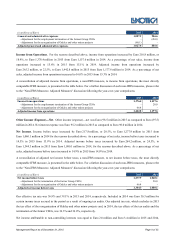
Adjusted selling expenses, excluding for 2015, expenses of Euro 5.5 million related to the reorganization of Oakley and
other minor projects, were Euro 2,773.3 million as compared to selling expenses of Euro 2,352.3 million in 2014. As
percentage of net sales adjusted selling expenses were 30.8% in 2015.
A reconciliation of adjusted selling expenses, a non-IFRS measure, to selling expenses, the most directly comparable IFRS
measure, is presented in the table below. For a further discussion of such non-IFRS measures, please refer to the “Non-IFRS
Measures: Adjusted Measures” discussion following the year-over-year comparisons.
(in millions of Euro) 2015
2014
Selling expenses
2,778.8
2,352.3
- Adjustment for the reorganization of Oakley and other minor projects (5.5)
-
Adjusted selling expenses 2,773.3
2,352.3
General and administrative expenses, including intangible asset amortization, increased by Euro 180.9 million, or 19.9%, to
Euro 1,087.5 million in 2015, as compared to Euro 906.6 million in 2014. As a percentage of net sales, general and
administrative expenses were 12.3% and 11.8% in 2015 and 2014. The increase was primarily related to the reorganization
of Oakley and for other minor projects of Euro 60.1 million.
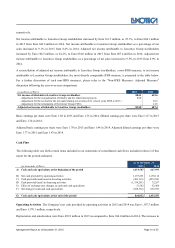
Adjusted general and administrative expenses increased by Euro 140.8 million, or 15.9%, to Euro 1,027.4 million in 2015 as
compared to Euro 886.6 million in 2014. This amount includes intangible asset amortization and excludes, in 2015 the
expenses related to the reorganization of Oakley and other minor projects of Euro 60.1 million and in 2014, the
non-recurring expenses of Euro 20.0 million related to the termination of the employment of the former Group CEOs. As a
percentage of net sales, adjusted general and administrative expenses decreased to 11.4% in 2015 from 11.5% in 2014.
A reconciliation of adjusted general and administrative expenses, a non-IFRS measure, to general and administrative
expenses, the most directly comparable IFRS measure, is presented in the table below. For a further discussion of such
non-IFRS measures, please refer to the “Non-IFRS Measures: Adjusted Measures” discussion following the year-over-year
comparisons