LensCrafters 2015 Annual Report Download - page 125
Download and view the complete annual report
Please find page 125 of the 2015 LensCrafters annual report below. You can navigate through the pages in the report by either clicking on the pages listed below, or by using the keyword search tool below to find specific information within the annual report.-
 1
1 -
2
-
3
-
4
-
5
-
6
-
7
-
8
-
9
-
10
-
11
-
12
-
13
-
14
-
15
-
16
-
17
-
18
-
19
-
20
-
21
-
22
-
23
-
24
-
25
-
26
-
27
-
28
-
29
-
30
-
31
-
32
-
33
-
34
-
35
-
36
-
37
-
38
-
39
-
40
-
41
-
42
-
43
-
44
-
45
-
46
-
47
-
48
-
49
-
50
-
51
-
52
-
53
-
54
-
55
-
56
-
57
-
58
-
59
-
60
-
61
-
62
-
63
-
64
-
65
-
66
-
67
-
68
-
69
-
70
-
71
-
72
-
73
-
74
-
75
-
76
-
77
-
78
-
79
-
80
-
81
-
82
-
83
-
84
-
85
-
86
-
87
-
88
-
89
-
90
-
91
-
92
-
93
-
94
-
95
-
96
-
97
-
98
-
99
-
100
-
101
-
102
-
103
-
104
-
105
-
106
-
107
-
108
-
109
-
110
-
111
-
112
-
113
-
114
-
 115
115 -
 116
116 -
 117
117 -
 118
118 -
 119
119 -
 120
120 -
 121
121 -
 122
122 -
 123
123 -
 124
124 -
 125
125 -
 126
126 -
 127
127 -
 128
128 -
 129
129 -
 130
130 -
 131
131 -
 132
132 -
 133
133 -
 134
134 -
 135
135 -
136
-
137
-
138
-
139
-
140
-
141
-
142
-
143
-
144
-
145
-
146
-
147
-
148
-
149
-
150
-
151
-
152
-
153
-
154
-
155
-
156
-
157
-
158
-
159
-
160
-
161
-
162
-
163
-
164
-
165
-
166
-
167
-
168
-
169
-
170
-
171
-
172
-
173
-
174
-
175
-
176
-
177
-
178
-
179
-
180
-
181
-
182
-
183
-
184
-
185
-
186
-
187
-
188
-
189
-
190
-
191
-
192
-
193
-
194
-
195
-
196
-
197
-
198
-
199
-
200
-
201
-
202
-
203
-
204
-
205
-
206
-
207
-
208
-
209
-
210
-
211
-
212
-
213
-
214
-
215
-
216
-
217
-
218
-
219
-
220
-
221
-
222
-
223
-
224
-
225
-
226
-
227
-
228
-
229
-
230
-
231
-
232
-
233
-
234
-
235
-
236
-
237
-
238
-
239
-
240
-
241
-
242
-
243
-
244
-
245
-
246
-
247
-
248
-
249
-
250
-
251
-
252
-
253
-
254
-
255
-
256
-
257
-
258
-
259
-
260
-
261
-
262
-
263
-
264
-
265
-
266
-
267
-
268
-
269
-
270
 |
 |
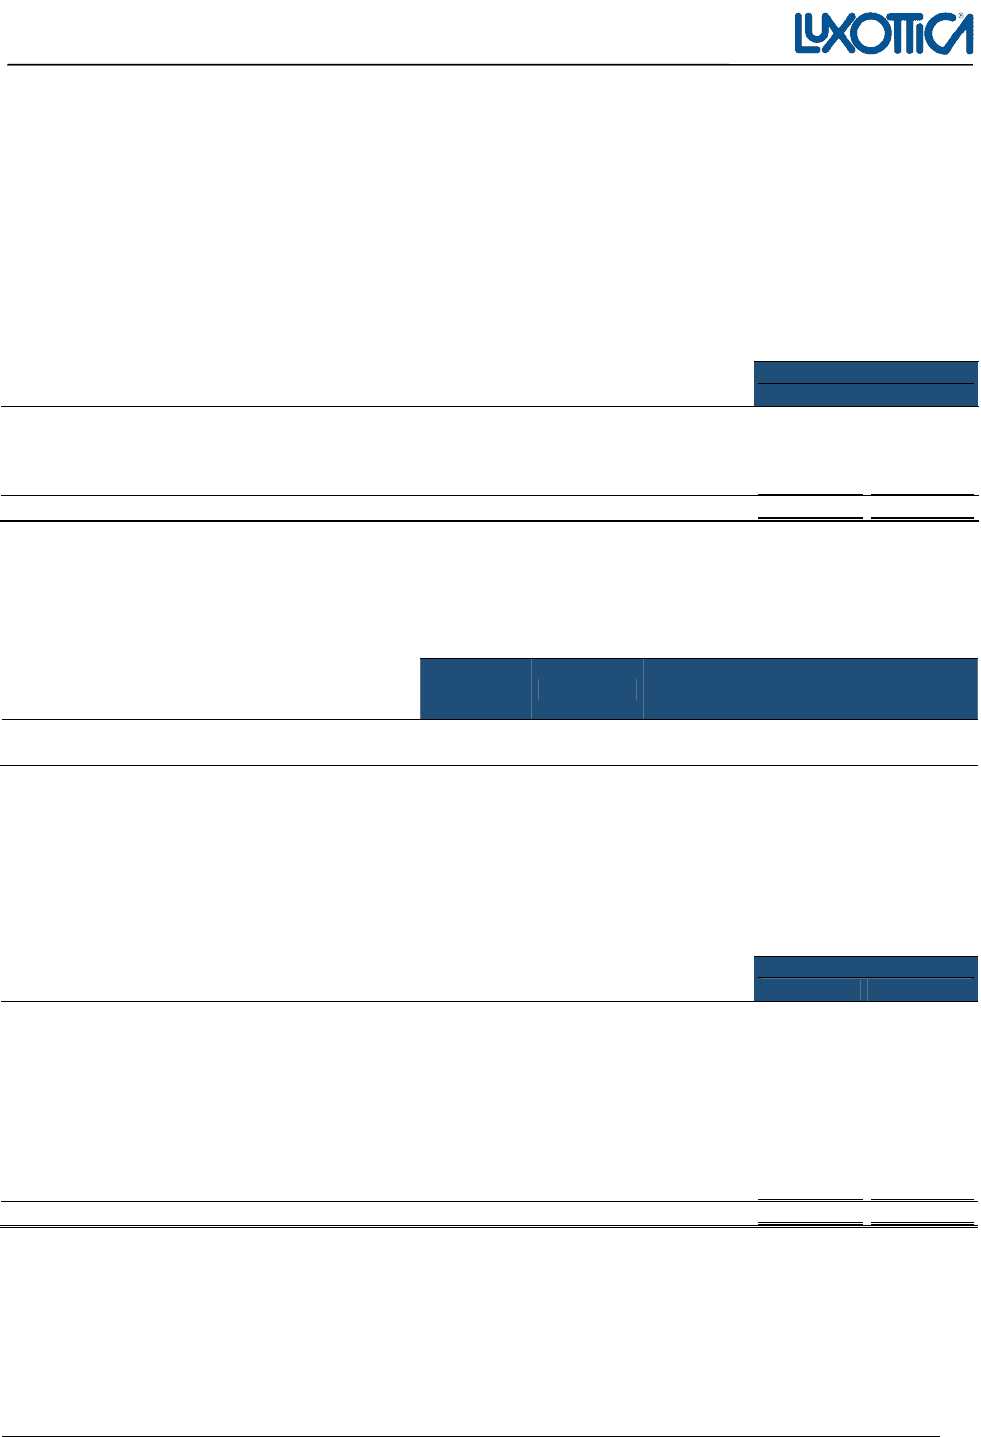
Notes to the consolidated financial statement as of December 31, 2015 Page 31 di 68
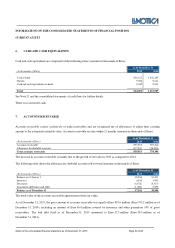
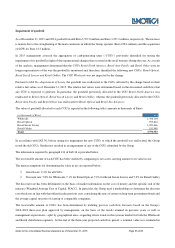
As of December 31, 2015, the amount of overdue receivables which were not included in the bad debt fund was equal to 9.9%
of gross receivables (8.0% as of December 31, 2014) and 10.3% of receivables net of the bad debt fund (8.4% as of
December 31, 2014). The Group does not expect any additional losses over amounts already provided for.
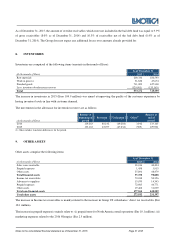
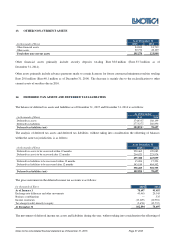
8. INVENTORIES
Inventories are comprised of the following items (amounts in thousands of Euro):
As of December 31
(In thousands of Euro) 2015
2014
Raw materials 200,336
186,593
Work in process 51,828
47,674
Finished goods 711,009
627,300
Less: inventory obsolescence reserves (129,901)
(133,163)
Total 833,272
728,404
The increase in inventories in 2015 (Euro 104.9 million) was aimed at improving the quality of the customer experience by
having inventory levels in line with customer demand.
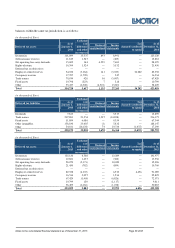
The movements in the allowance for inventories reserve are as follows:
(in thousands of Euro)
Balance at
beginning of
period
Provision Utilization Other(1)
Balance at
end of
period
2014 119,263
80,142
(69,284)
3,042
133,163
2015 133,163
65,077
(67,834)
(505)
129,901
(1) Other includes translation differences for the period.
9. OTHER ASSETS
Other assets comprise the following items:
As of December 31
(in thousands of Euro) 2015
2014
Sales taxes receivable 38,016
40,494
Prepaid expenses 1,458
1,915
Other assets 55,896
48,479
Total financial assets 95,370
90,888
Income tax receivables 70,038
50,356
Advances to suppliers 15,070
14,343
Prepaid expenses 72,985
44,771
Other assets 19,468
31,039
Total non-financial assets 177,561
140,509
Total other assets 272,932
231,397
The increase in Income tax receivables is mainly related to the increase in Group US subsidiaries’ direct tax receivables (Eur
18.1 million).
The increase in prepaid expense is mainly relate to: (i) prepaid rents for North America retail operations (Eur 10.1 million); (ii)
marketing expenses related to the 2016 Olympics (Eur 2.5 million).