LensCrafters 2015 Annual Report Download - page 245
Download and view the complete annual report
Please find page 245 of the 2015 LensCrafters annual report below. You can navigate through the pages in the report by either clicking on the pages listed below, or by using the keyword search tool below to find specific information within the annual report.-
 1
1 -
2
-
3
-
4
-
5
-
6
-
7
-
8
-
9
-
10
-
11
-
12
-
13
-
14
-
15
-
16
-
17
-
18
-
19
-
20
-
21
-
22
-
23
-
24
-
25
-
26
-
27
-
28
-
29
-
30
-
31
-
32
-
33
-
34
-
35
-
36
-
37
-
38
-
39
-
40
-
41
-
42
-
43
-
44
-
45
-
46
-
47
-
48
-
49
-
50
-
51
-
52
-
53
-
54
-
55
-
56
-
57
-
58
-
59
-
60
-
61
-
62
-
63
-
64
-
65
-
66
-
67
-
68
-
69
-
70
-
71
-
72
-
73
-
74
-
75
-
76
-
77
-
78
-
79
-
80
-
81
-
82
-
83
-
84
-
85
-
86
-
87
-
88
-
89
-
90
-
91
-
92
-
93
-
94
-
95
-
96
-
97
-
98
-
99
-
100
-
101
-
102
-
103
-
104
-
105
-
106
-
107
-
108
-
109
-
110
-
111
-
112
-
113
-
114
-
115
-
116
-
117
-
118
-
119
-
120
-
121
-
122
-
123
-
124
-
125
-
126
-
127
-
128
-
129
-
130
-
131
-
132
-
133
-
134
-
135
-
136
-
137
-
138
-
139
-
140
-
141
-
142
-
143
-
144
-
145
-
146
-
147
-
148
-
149
-
150
-
151
-
152
-
153
-
154
-
155
-
156
-
157
-
158
-
159
-
160
-
161
-
162
-
163
-
164
-
165
-
166
-
167
-
168
-
169
-
170
-
171
-
172
-
173
-
174
-
175
-
176
-
177
-
178
-
179
-
180
-
181
-
182
-
183
-
184
-
185
-
186
-
187
-
188
-
189
-
190
-
191
-
192
-
193
-
194
-
195
-
196
-
197
-
198
-
199
-
200
-
201
-
202
-
203
-
204
-
205
-
206
-
207
-
208
-
209
-
210
-
211
-
212
-
213
-
214
-
215
-
216
-
217
-
218
-
219
-
220
-
221
-
222
-
223
-
224
-
225
-
226
-
227
-
228
-
229
-
230
-
231
-
232
-
233
-
234
-
 235
235 -
 236
236 -
 237
237 -
 238
238 -
 239
239 -
 240
240 -
 241
241 -
 242
242 -
 243
243 -
 244
244 -
 245
245 -
 246
246 -
 247
247 -
 248
248 -
 249
249 -
 250
250 -
 251
251 -
 252
252 -
 253
253 -
 254
254 -
 255
255 -
256
-
257
-
258
-
259
-
260
-
261
-
262
-
263
-
264
-
265
-
266
-
267
-
268
-
269
-
270
 |
 |

Notes to the separate financial statements as of December 31, 2015 Page 65 of 77
platform must also allow communicative interaction between members of the supply chain. Decree no.
00098MI01 issued by Italy's Ministry for Economic Development on December 21, 2012 recognized a total
grant of Euro 13,747,949 towards the cost of this project along with other benefits of Euro 4,247,627. The
Luxottica Group's share of the total grant is Euro 5,030,748, while its share of the other benefits is Euro
1,445,349.
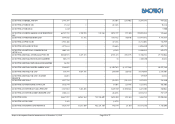
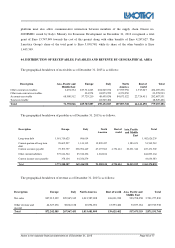
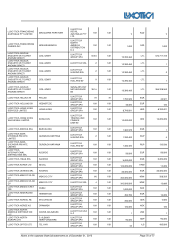
44. DISTRIBUTION OF RECEIVABLES, PAYABLES AND REVENUE BY GEOGRAPHICAL AREA
The geographical breakdown of receivables as of December 31, 2015 is as follows:
Description Asia, Pacific and
Middle East
Europe
Italy
North
America
Rest of
world
Total
Other current receivables 2,491,534
227,721,623
204,569,076
17,959,956
1,917,047
454,659,236
Other non-current receivables 334,974
18,873,709
4,370,250
23,578,933
Accounts receivable 68,900,512
57,729,210
48,459,836
84,673,522
22,724,451
282,487,531
Taxes receivable
18,529,406
18,529,406
Total 71,392,046
285,785,807
290,432,027
107,003,728
24,641,498
779,255,106
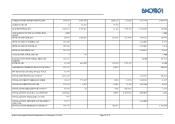
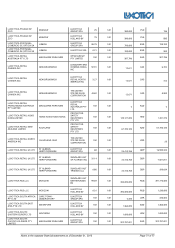
The geographical breakdown of payables as of December 31, 2015 is as follows:
Description Europe
Italy
North
America
Rest of
world
Asia, Pacific
and Middle
East
Total
Long-term debt 1,091,719,625
906,614
1,092,626,239
Current-portion of long term
debt
28,602,297
1,143,112
19,820,457
1,983,673
51,549,539
Current accounts payable 75,193,797
238,094,449
67,197,563
4,754,414
22,231,346
407,471,569
Other current liabilities 575,614,564
85,016,496
4,262,104
664,893,164
Current income taxes payable 378,104
44,256,279
44,634,383
Total 1,771,508,387
369,416,950
91,280,124
4,754,414
24,215,019
2,261,174,894
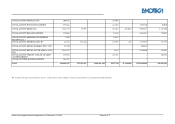
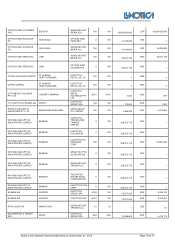
The geographical breakdown of revenue as of December 31, 2015 is as follows:
Description Europe
Italy
North America
Rest of world
Asia, Pacific and
Middle East
Total
Net sales 827,915,329
229,945,315
1,013,587,008
126,031,920
523,798,258
2,721,277,830
Other revenue and
income
44,327,256
38,022,138
20,094,001
13,593,482
33,877,061
149,913,938
Total 872,242,585
267,967,453
1,033,681,009
139,625,402
557,675,319
2,871,191,768