LensCrafters 2015 Annual Report Download - page 13
Download and view the complete annual report
Please find page 13 of the 2015 LensCrafters annual report below. You can navigate through the pages in the report by either clicking on the pages listed below, or by using the keyword search tool below to find specific information within the annual report.-
 1
1 -
2
-
 3
3 -
 4
4 -
 5
5 -
 6
6 -
 7
7 -
 8
8 -
 9
9 -
 10
10 -
 11
11 -
 12
12 -
 13
13 -
 14
14 -
 15
15 -
 16
16 -
 17
17 -
 18
18 -
 19
19 -
 20
20 -
 21
21 -
 22
22 -
 23
23 -
24
-
25
-
26
-
27
-
28
-
29
-
30
-
31
-
32
-
33
-
34
-
35
-
36
-
37
-
38
-
39
-
40
-
41
-
42
-
43
-
44
-
45
-
46
-
47
-
48
-
49
-
50
-
51
-
52
-
53
-
54
-
55
-
56
-
57
-
58
-
59
-
60
-
61
-
62
-
63
-
64
-
65
-
66
-
67
-
68
-
69
-
70
-
71
-
72
-
73
-
74
-
75
-
76
-
77
-
78
-
79
-
80
-
81
-
82
-
83
-
84
-
85
-
86
-
87
-
88
-
89
-
90
-
91
-
92
-
93
-
94
-
95
-
96
-
97
-
98
-
99
-
100
-
101
-
102
-
103
-
104
-
105
-
106
-
107
-
108
-
109
-
110
-
111
-
112
-
113
-
114
-
115
-
116
-
117
-
118
-
119
-
120
-
121
-
122
-
123
-
124
-
125
-
126
-
127
-
128
-
129
-
130
-
131
-
132
-
133
-
134
-
135
-
136
-
137
-
138
-
139
-
140
-
141
-
142
-
143
-
144
-
145
-
146
-
147
-
148
-
149
-
150
-
151
-
152
-
153
-
154
-
155
-
156
-
157
-
158
-
159
-
160
-
161
-
162
-
163
-
164
-
165
-
166
-
167
-
168
-
169
-
170
-
171
-
172
-
173
-
174
-
175
-
176
-
177
-
178
-
179
-
180
-
181
-
182
-
183
-
184
-
185
-
186
-
187
-
188
-
189
-
190
-
191
-
192
-
193
-
194
-
195
-
196
-
197
-
198
-
199
-
200
-
201
-
202
-
203
-
204
-
205
-
206
-
207
-
208
-
209
-
210
-
211
-
212
-
213
-
214
-
215
-
216
-
217
-
218
-
219
-
220
-
221
-
222
-
223
-
224
-
225
-
226
-
227
-
228
-
229
-
230
-
231
-
232
-
233
-
234
-
235
-
236
-
237
-
238
-
239
-
240
-
241
-
242
-
243
-
244
-
245
-
246
-
247
-
248
-
249
-
250
-
251
-
252
-
253
-
254
-
255
-
256
-
257
-
258
-
259
-
260
-
261
-
262
-
263
-
264
-
265
-
266
-
267
-
268
-
269
-
270
 |
 |
Management Report as of December 31, 2015 Page 9 of 35
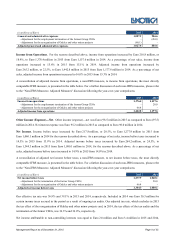
(in millions of Euro) 2015
2014
General and administrative expenses 1,087.5
906.6
- Adjustment for the employment termination of the former Group CEOs -
(20.0)
- Adjustment for the reorganization of Oakley and other minor projects (60.1)
-
Adjusted general and administrative expenses 1,027.4
886.6
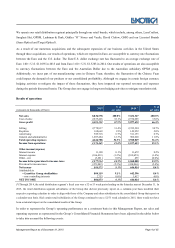
Income from Operations. For the reasons described above, income from operations increased by Euro 218.8 million, or
18.9%, to Euro 1,376.4 million in 2015 from Euro 1,157.6 million in 2014. As a percentage of net sales, income from
operations increased to 15.6% in 2015 from 15.1% in 2014. Adjusted income from operations increased by
Euro 265.2 million, or 22.5%, to Euro 1,442.8 million in 2015 from Euro 1,177.6 million in 2014. As a percentage of net
sales, adjusted income from operations increased to 16.0% in 2015 from 15.3% in 2014.
A reconciliation of adjusted income from operations, a non-IFRS measure, to income from operations, the most directly
comparable IFRS measure, is presented in the table below. For a further discussion of such non-IFRS measures, please refer
to the “Non-IFRS Measures: Adjusted Measures” discussion following the year-over-year comparisons.
(in millions of Euro) 2015
2014
Income from operations 1,376.4
1,157.6
- Adjustment for the employment termination of the former Group CEOs -
20.0
- Adjustment for the reorganization of Oakley and other minor projects 66.4
-
Adjusted income from operations 1,442.8
1,177.6
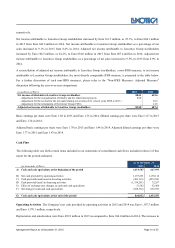
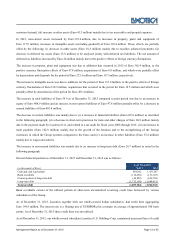
Other Income (Expense)—Net. Other income (expense)—net was Euro (98.5) million in 2015 as compared to Euro (97.5)
million in 2014. Net interest expense was Euro 95.2 million in 2015 as compared to Euro 98.0 million in 2014.
Net Income. Income before taxes increased by Euro 217.8 million, or 20.5%, to Euro 1,277.9 million in 2015 from
Euro 1,060.1 million in 2014 for the reasons described above. As a percentage of net sales, income before taxes increased to
14.5% in 2015 from 13.9% in 2014. Adjusted income before taxes increased by Euro 264.2 million, or 24.5%, to
Euro 1,344.3 million in 2015 from Euro 1,080.1 million in 2014, for the reasons described above. As a percentage of net
sales, adjusted income before taxes increased to 14.9% in 2015 from 14.0% in 2014.
A reconciliation of adjusted net income before taxes, a non-IFRS measure, to net income before taxes, the most directly
comparable IFRS measure, is presented in the table below. For a further discussion of such non-IFRS measures, please refer
to the “Non-IFRS Measures: Adjusted Measures” discussion following the year-over-year comparisons.
(in millions of Euro) 2015
2014
Net income before taxes 1,277.9
1,060.1
- Adjustment for the termination of the former Group CEOs -
20.0
- Adjustment for the reorganization of Oakley and other minor projects 66.4
-
Adjusted net income before taxes 1,344.3
1,080.1
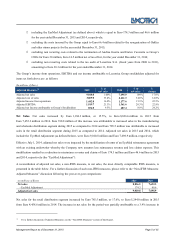
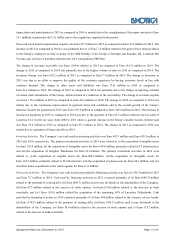
Our effective tax rate was 36.9% and 39.1% in 2015 and 2014, respectively. Included in 2014 was Euro 30.3 million for
certain income taxes accrued in the period as a result of ongoing tax audits. Our adjusted tax rate, which excludes in 2015
the tax effect of the reorganization of Oakley and other minor projects and, in 2014, the tax effects of the tax audits and the
termination of the former CEOs, was 36.3% and 36.0%, respectively.
Net income attributable to non-controlling interests was equal to Euro 2.8 million and Euro 3.4 million in 2015 and 2014,