LensCrafters 2015 Annual Report Download - page 189
Download and view the complete annual report
Please find page 189 of the 2015 LensCrafters annual report below. You can navigate through the pages in the report by either clicking on the pages listed below, or by using the keyword search tool below to find specific information within the annual report.-
 1
1 -
2
-
3
-
4
-
5
-
6
-
7
-
8
-
9
-
10
-
11
-
12
-
13
-
14
-
15
-
16
-
17
-
18
-
19
-
20
-
21
-
22
-
23
-
24
-
25
-
26
-
27
-
28
-
29
-
30
-
31
-
32
-
33
-
34
-
35
-
36
-
37
-
38
-
39
-
40
-
41
-
42
-
43
-
44
-
45
-
46
-
47
-
48
-
49
-
50
-
51
-
52
-
53
-
54
-
55
-
56
-
57
-
58
-
59
-
60
-
61
-
62
-
63
-
64
-
65
-
66
-
67
-
68
-
69
-
70
-
71
-
72
-
73
-
74
-
75
-
76
-
77
-
78
-
79
-
80
-
81
-
82
-
83
-
84
-
85
-
86
-
87
-
88
-
89
-
90
-
91
-
92
-
93
-
94
-
95
-
96
-
97
-
98
-
99
-
100
-
101
-
102
-
103
-
104
-
105
-
106
-
107
-
108
-
109
-
110
-
111
-
112
-
113
-
114
-
115
-
116
-
117
-
118
-
119
-
120
-
121
-
122
-
123
-
124
-
125
-
126
-
127
-
128
-
129
-
130
-
131
-
132
-
133
-
134
-
135
-
136
-
137
-
138
-
139
-
140
-
141
-
142
-
143
-
144
-
145
-
146
-
147
-
148
-
149
-
150
-
151
-
152
-
153
-
154
-
155
-
156
-
157
-
158
-
159
-
160
-
161
-
162
-
163
-
164
-
165
-
166
-
167
-
168
-
169
-
170
-
171
-
172
-
173
-
174
-
175
-
176
-
177
-
178
-
 179
179 -
 180
180 -
 181
181 -
 182
182 -
 183
183 -
 184
184 -
 185
185 -
 186
186 -
 187
187 -
 188
188 -
 189
189 -
 190
190 -
 191
191 -
 192
192 -
 193
193 -
 194
194 -
 195
195 -
 196
196 -
 197
197 -
 198
198 -
 199
199 -
200
-
201
-
202
-
203
-
204
-
205
-
206
-
207
-
208
-
209
-
210
-
211
-
212
-
213
-
214
-
215
-
216
-
217
-
218
-
219
-
220
-
221
-
222
-
223
-
224
-
225
-
226
-
227
-
228
-
229
-
230
-
231
-
232
-
233
-
234
-
235
-
236
-
237
-
238
-
239
-
240
-
241
-
242
-
243
-
244
-
245
-
246
-
247
-
248
-
249
-
250
-
251
-
252
-
253
-
254
-
255
-
256
-
257
-
258
-
259
-
260
-
261
-
262
-
263
-
264
-
265
-
266
-
267
-
268
-
269
-
270
 |
 |

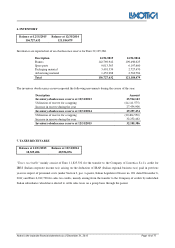
Notes to the separate financial statements as of December 31, 2015 Page 9 of 77
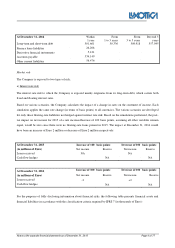
At December 31, 2014 Within
1 year
From
1 to 3 years
From
3 to 5 years
Beyond 5
years
Long-term and short-term debt 501,661
50,336
509,918
557,045
Finance lease liabilities 26,208
Derivative financial instruments 5,121
Accounts payable 334,149
Other current liabilities 56,476
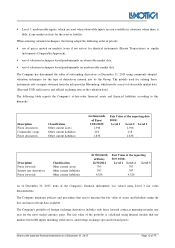
Market risk
The Company is exposed to two types of risk:
a) Interest rate risk
The interest rate risk to which the Company is exposed mainly originates from its long-term debt, which carries both
fixed and floating interest rates.
Based on various scenarios, the Company calculates the impact of a change in rates on the statement of income. Each
simulation applies the same rate change (in terms of basis points) to all currencies. The various scenarios are developed
for only those floating-rate liabilities not hedged against interest rate risk. Based on the simulations performed, the post-
tax impact on net income for 2015 of a rate increase/decrease of 100 basis points, assuming all other variables remain
equal, would be zero since there were no floating-rate loans present in 2015. The impact at December 31, 2014 would
have been an increase of Euro 2 million or decrease of Euro 2 million respectively.
At December 31, 2015 Increase of 100
basis points Decrease of 100
basis points
(in millions of Euro) Net income Reserve Net income Reserve
Loans received NA NA
Cash flow hedges NA NA
At December 31, 2014 Increase of 100
basis points Decrease of 100
basis points
(in millions of Euro) Net income Reserve Net income Reserve
Loans received -2
+2
Cash flow hedges NA NA
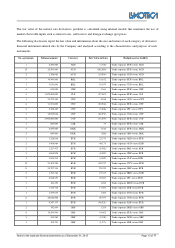
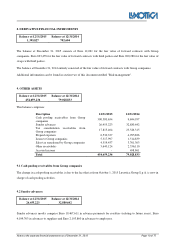
For the purposes of fully disclosing information about financial risks, the following table presents financial assets and
financial liabilities in accordance with the classification criteria required by IFRS 7 (in thousands of Euro):