LensCrafters 2015 Annual Report Download - page 118
Download and view the complete annual report
Please find page 118 of the 2015 LensCrafters annual report below. You can navigate through the pages in the report by either clicking on the pages listed below, or by using the keyword search tool below to find specific information within the annual report.-
 1
1 -
2
-
3
-
4
-
5
-
6
-
7
-
8
-
9
-
10
-
11
-
12
-
13
-
14
-
15
-
16
-
17
-
18
-
19
-
20
-
21
-
22
-
23
-
24
-
25
-
26
-
27
-
28
-
29
-
30
-
31
-
32
-
33
-
34
-
35
-
36
-
37
-
38
-
39
-
40
-
41
-
42
-
43
-
44
-
45
-
46
-
47
-
48
-
49
-
50
-
51
-
52
-
53
-
54
-
55
-
56
-
57
-
58
-
59
-
60
-
61
-
62
-
63
-
64
-
65
-
66
-
67
-
68
-
69
-
70
-
71
-
72
-
73
-
74
-
75
-
76
-
77
-
78
-
79
-
80
-
81
-
82
-
83
-
84
-
85
-
86
-
87
-
88
-
89
-
90
-
91
-
92
-
93
-
94
-
95
-
96
-
97
-
98
-
99
-
100
-
101
-
102
-
103
-
104
-
105
-
106
-
107
-
 108
108 -
 109
109 -
 110
110 -
 111
111 -
 112
112 -
 113
113 -
 114
114 -
 115
115 -
 116
116 -
 117
117 -
 118
118 -
 119
119 -
 120
120 -
 121
121 -
 122
122 -
 123
123 -
 124
124 -
 125
125 -
 126
126 -
 127
127 -
 128
128 -
129
-
130
-
131
-
132
-
133
-
134
-
135
-
136
-
137
-
138
-
139
-
140
-
141
-
142
-
143
-
144
-
145
-
146
-
147
-
148
-
149
-
150
-
151
-
152
-
153
-
154
-
155
-
156
-
157
-
158
-
159
-
160
-
161
-
162
-
163
-
164
-
165
-
166
-
167
-
168
-
169
-
170
-
171
-
172
-
173
-
174
-
175
-
176
-
177
-
178
-
179
-
180
-
181
-
182
-
183
-
184
-
185
-
186
-
187
-
188
-
189
-
190
-
191
-
192
-
193
-
194
-
195
-
196
-
197
-
198
-
199
-
200
-
201
-
202
-
203
-
204
-
205
-
206
-
207
-
208
-
209
-
210
-
211
-
212
-
213
-
214
-
215
-
216
-
217
-
218
-
219
-
220
-
221
-
222
-
223
-
224
-
225
-
226
-
227
-
228
-
229
-
230
-
231
-
232
-
233
-
234
-
235
-
236
-
237
-
238
-
239
-
240
-
241
-
242
-
243
-
244
-
245
-
246
-
247
-
248
-
249
-
250
-
251
-
252
-
253
-
254
-
255
-
256
-
257
-
258
-
259
-
260
-
261
-
262
-
263
-
264
-
265
-
266
-
267
-
268
-
269
-
270
 |
 |
Notes to the consolidated financial statement as of December 31, 2015 Page 24 di 68
of the Group consolidated stockholders’ equity. In addition, the sale of assets of the Company and its subsidiaries is limited to
a maximum threshold of 10% of consolidated assets.
Default with respect to the abovementioned clauses and following a grace period during which the default can be remedied,
would be considered a material breach of the contractual obligations pursuant to the financing agreements of the Group.
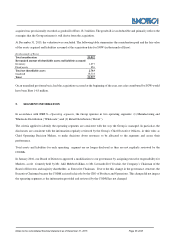
Financial covenants require the Group to comply with specific levels of financial ratios. The most significant covenants
establish a threshold for the ratio of net debt of the Group to EBITDA (Earnings before interest, taxes, depreciation and
amortization) as well as EBITDA to financial charges and priority debt to share equity. The covenants are reported in the
following table:
Net Financial Position/Pro forma EBITDA <3.5
EBITDA/financial charges >5
Priority Debt/Share Equity <20%
An explanation of the covenants referenced above is provided as follows:
1 "Net Financial Position/Proforma EBITDA": this is an indicator of the prospective sustainability of debt repayments;
the lower the absolute value, the greater a company's ability to repay the debt (as indicated by the Net Financial
Position) through the generation of gross cash flows from ordinary operations (as indicated by the amount of
EBITDA);
1 "EBITDA / Pro forma Finance Charges": this is an indicator of financial leverage; the higher the value, the greater a
company's ability to produce adequate resources to cover finance-related expenses
1 " Priority Debt/Share Equity": this is an indicator of the ability to achieve financial equilibrium between internal and
third-party sources of funding; the lower the ratio, the greater a company's ability to fund itself.
In the case of a failure to comply with the abovementioned ratios, the Group may be called upon to pay the outstanding debt if
it does not correct such default within the period indicated in the loan agreement.
Compliance with these covenants is monitored by the Group at the end of each quarter and, as of December 31, 2015, the Group
was fully in compliance with these covenants. The Group also analyzes the trend of these covenants in order to monitor its
compliance and, as of today, the analysis indicates that the ratios of the Group are below the thresholds which would result
in default.
Fair value
In order to determine the fair value of financial instruments, the Group utilizes valuation techniques which are based on
observable market prices (Mark to Model). These techniques therefore fall within Level 2 of the hierarchy of Fair Values
identified by IFRS 13—Fair Value.
IFRS 13 refer to valuation hierarchy techniques that are based on three levels:
1 Level 1: Inputs are quoted prices in an active market for identical assets or liabilities;
1 Level 2: Inputs used in the valuations, other than the prices listed in Level 1, are observable for each financial asset or
liability, both directly (prices) and indirectly (derived from prices); and
1 Level 3: Unobservable inputs used when observable inputs are not available in situations where there is little, if any,