LensCrafters 2015 Annual Report Download - page 14
Download and view the complete annual report
Please find page 14 of the 2015 LensCrafters annual report below. You can navigate through the pages in the report by either clicking on the pages listed below, or by using the keyword search tool below to find specific information within the annual report.-
 1
1 -
2
-
3
-
 4
4 -
 5
5 -
 6
6 -
 7
7 -
 8
8 -
 9
9 -
 10
10 -
 11
11 -
 12
12 -
 13
13 -
 14
14 -
 15
15 -
 16
16 -
 17
17 -
 18
18 -
 19
19 -
 20
20 -
 21
21 -
 22
22 -
 23
23 -
 24
24 -
25
-
26
-
27
-
28
-
29
-
30
-
31
-
32
-
33
-
34
-
35
-
36
-
37
-
38
-
39
-
40
-
41
-
42
-
43
-
44
-
45
-
46
-
47
-
48
-
49
-
50
-
51
-
52
-
53
-
54
-
55
-
56
-
57
-
58
-
59
-
60
-
61
-
62
-
63
-
64
-
65
-
66
-
67
-
68
-
69
-
70
-
71
-
72
-
73
-
74
-
75
-
76
-
77
-
78
-
79
-
80
-
81
-
82
-
83
-
84
-
85
-
86
-
87
-
88
-
89
-
90
-
91
-
92
-
93
-
94
-
95
-
96
-
97
-
98
-
99
-
100
-
101
-
102
-
103
-
104
-
105
-
106
-
107
-
108
-
109
-
110
-
111
-
112
-
113
-
114
-
115
-
116
-
117
-
118
-
119
-
120
-
121
-
122
-
123
-
124
-
125
-
126
-
127
-
128
-
129
-
130
-
131
-
132
-
133
-
134
-
135
-
136
-
137
-
138
-
139
-
140
-
141
-
142
-
143
-
144
-
145
-
146
-
147
-
148
-
149
-
150
-
151
-
152
-
153
-
154
-
155
-
156
-
157
-
158
-
159
-
160
-
161
-
162
-
163
-
164
-
165
-
166
-
167
-
168
-
169
-
170
-
171
-
172
-
173
-
174
-
175
-
176
-
177
-
178
-
179
-
180
-
181
-
182
-
183
-
184
-
185
-
186
-
187
-
188
-
189
-
190
-
191
-
192
-
193
-
194
-
195
-
196
-
197
-
198
-
199
-
200
-
201
-
202
-
203
-
204
-
205
-
206
-
207
-
208
-
209
-
210
-
211
-
212
-
213
-
214
-
215
-
216
-
217
-
218
-
219
-
220
-
221
-
222
-
223
-
224
-
225
-
226
-
227
-
228
-
229
-
230
-
231
-
232
-
233
-
234
-
235
-
236
-
237
-
238
-
239
-
240
-
241
-
242
-
243
-
244
-
245
-
246
-
247
-
248
-
249
-
250
-
251
-
252
-
253
-
254
-
255
-
256
-
257
-
258
-
259
-
260
-
261
-
262
-
263
-
264
-
265
-
266
-
267
-
268
-
269
-
270
 |
 |

Management Report as of December 31, 2015 Page 10 of 35
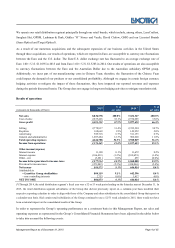
respectively.
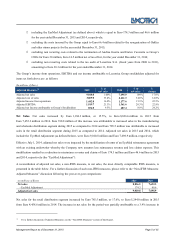
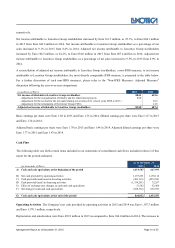
Net income attributable to Luxottica Group stockholders increased by Euro 161.5 million, or 25.1%, to Euro 804.1 million
in 2015 from Euro 642.6 million in 2014. Net income attributable to Luxottica Group stockholders as a percentage of net
sales increased to 9.1% in 2015 from 8.4% in 2014. Adjusted net income attributable to Luxottica Group stockholders
increased by Euro 166.5 million, or 24.2%, to Euro 854.0 million in 2015 from Euro 687.4 million in 2014. Adjusted net
income attributable to Luxottica Group stockholders as a percentage of net sales increased to 9.5% in 2015 from 8.9% in
2014.
A reconciliation of adjusted net income attributable to Luxottica Group stockholders, a non-IFRS measure, to net income
attributable to Luxottica Group stockholders, the most directly comparable IFRS measure, is presented in the table below.
For a further discussion of such non-IFRS measures, please refer to the “Non-IFRS Measures: Adjusted Measures”
discussion following the year-over-year comparisons.
(in millions of Euro) 2015 2014
Net income attributable to Luxottica Group stockholders
804.1
642.6
- Adjustment for the reorganization of Oakley and for other minor projects 49.8
-
- Adjustment for the accrual for the tax audit relating to Luxottica S.r.l. (fiscal years 2008 to 2011) -
30.3
-
Adjustment for the termination of the former Group CEOs
-
14.5
Adjusted net income attributable to Luxottica Group stockholders 854.0
687.4
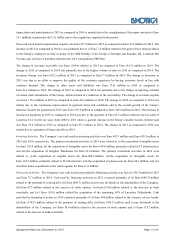
Basic earnings per share were Euro 1.68 in 2015 and Euro 1.35 in 2014. Diluted earnings per share were Euro 1.67 in 2015
and Euro 1.34 in 2014.
Adjusted basic earnings per share were Euro 1.78 in 2015 and Euro 1.44 in 2014. Adjusted diluted earnings per share were
Euro 1.77 in 2015 and Euro 1.43 in 2014.
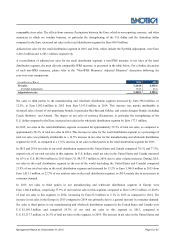
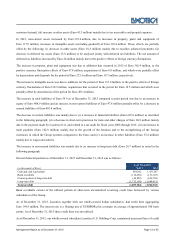
Cash Flow
The following table sets forth certain items included in our statements of consolidated cash flows included in Item 2 of this
report for the periods indicated.
As of December 31
(in thousands of Euro) 2015
2014
A)
Cash and cash equivalents at the beginning of the period 1,453,587
617,995
B) Net cash provided by operating activities 1,197,291
1,170,116
C) Cash provided/(used) used in investing activities (483,319)
(459,254)
D)
Cash provided/(used) in financing activities (1,354,291)
72,267
E) Effect of exchange rate changes on cash and cash equivalents 51,582
52,464
F) Net change in cash and cash equivalents (588,735)
835,593
G)
Cash and cash equivalents at the end of the period 864,852
1,453,587
Operating Activities. The Company’s net cash provided by operating activities in 2015 and 2014 was Euro 1,197.3 million
and Euro 1,170.1 million, respectively.
Depreciation and amortization were Euro 476.9 million in 2015 as compared to Euro 384.0 million in 2014. The increase in