LensCrafters 2015 Annual Report Download - page 11
Download and view the complete annual report
Please find page 11 of the 2015 LensCrafters annual report below. You can navigate through the pages in the report by either clicking on the pages listed below, or by using the keyword search tool below to find specific information within the annual report.-
 1
1 -
 2
2 -
 3
3 -
 4
4 -
 5
5 -
 6
6 -
 7
7 -
 8
8 -
 9
9 -
 10
10 -
 11
11 -
 12
12 -
 13
13 -
 14
14 -
 15
15 -
 16
16 -
 17
17 -
 18
18 -
 19
19 -
 20
20 -
 21
21 -
 22
22 -
23
-
24
-
25
-
26
-
27
-
28
-
29
-
30
-
31
-
32
-
33
-
34
-
35
-
36
-
37
-
38
-
39
-
40
-
41
-
42
-
43
-
44
-
45
-
46
-
47
-
48
-
49
-
50
-
51
-
52
-
53
-
54
-
55
-
56
-
57
-
58
-
59
-
60
-
61
-
62
-
63
-
64
-
65
-
66
-
67
-
68
-
69
-
70
-
71
-
72
-
73
-
74
-
75
-
76
-
77
-
78
-
79
-
80
-
81
-
82
-
83
-
84
-
85
-
86
-
87
-
88
-
89
-
90
-
91
-
92
-
93
-
94
-
95
-
96
-
97
-
98
-
99
-
100
-
101
-
102
-
103
-
104
-
105
-
106
-
107
-
108
-
109
-
110
-
111
-
112
-
113
-
114
-
115
-
116
-
117
-
118
-
119
-
120
-
121
-
122
-
123
-
124
-
125
-
126
-
127
-
128
-
129
-
130
-
131
-
132
-
133
-
134
-
135
-
136
-
137
-
138
-
139
-
140
-
141
-
142
-
143
-
144
-
145
-
146
-
147
-
148
-
149
-
150
-
151
-
152
-
153
-
154
-
155
-
156
-
157
-
158
-
159
-
160
-
161
-
162
-
163
-
164
-
165
-
166
-
167
-
168
-
169
-
170
-
171
-
172
-
173
-
174
-
175
-
176
-
177
-
178
-
179
-
180
-
181
-
182
-
183
-
184
-
185
-
186
-
187
-
188
-
189
-
190
-
191
-
192
-
193
-
194
-
195
-
196
-
197
-
198
-
199
-
200
-
201
-
202
-
203
-
204
-
205
-
206
-
207
-
208
-
209
-
210
-
211
-
212
-
213
-
214
-
215
-
216
-
217
-
218
-
219
-
220
-
221
-
222
-
223
-
224
-
225
-
226
-
227
-
228
-
229
-
230
-
231
-
232
-
233
-
234
-
235
-
236
-
237
-
238
-
239
-
240
-
241
-
242
-
243
-
244
-
245
-
246
-
247
-
248
-
249
-
250
-
251
-
252
-
253
-
254
-
255
-
256
-
257
-
258
-
259
-
260
-
261
-
262
-
263
-
264
-
265
-
266
-
267
-
268
-
269
-
270
 |
 |
Management Report as of December 31, 2015 Page 7 of 35
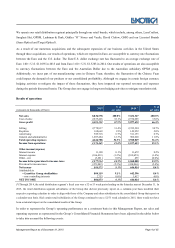
Canada in 2015 compared to 2014 was primarily due to a general increase in consumer demand. In 2015, net sales to third
parties in our manufacturing and wholesale distribution segment in the rest of the world were Euro 1,177.9 million,
comprising 32.8% of our total net sales in this segment, compared to Euro 1,057.2 million, or 33.1% of our net sales in this
segment, in 2014. The increase of Euro 120.7 million, or 11.4%, in 2015 as compared to 2014 was due to an increase in
consumer demand, in particular in the emerging markets.
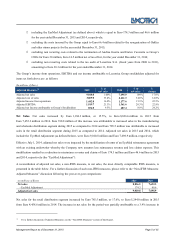
Cost of Sales. Cost of sales increased by Euro 260.7 million, or 10.1%, to Euro 2,835.4 million in 2015 from
Euro 2,574.7 million in 2014. As a percentage of net sales, cost of sales was 32.1% and 33.6% in 2015 and 2014,
respectively. The average number of frames produced daily in our facilities was approximately 346,991 and 297,000 in
2015 and 2014, respectively.
Adjusted cost of sales was Euro 3,009.0 million and Euro 2,621.3 million, in 2015 and 2014, respectively. This includes the
EyeMed Adjustment of Euro 174.3 million and expenses of Euro 0.7 million related to the reorganization of Oakley and
other minor projects in 2015 and includes the EyeMed Adjustment of Euro 46.6 million in 2014.
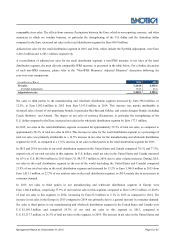
A reconciliation of adjusted cost of sales, a non-IFRS measure, to cost of sales, the most directly comparable IFRS measure,
is presented in the table below. For a further discussion of such non-IFRS measures, please refer to the “Non-IFRS
Measures: Adjusted Measures” discussion following the year-over-year comparisons.
(in millions of Euro)
2015
2014
Cost of sales
2,835.4
2,574.7
- EyeMed Adjustment 174.3
46.6
-
Adjustment for the reorganization of Oakley and other minor projects
(0.7)
-
Adjusted cost of sales 3,009.0
2,621.3
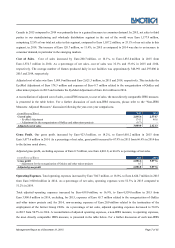
Gross Profit. Our gross profit increased by Euro 923.5 million, or 18.2%, to Euro 6,001.2 million in 2015 from
Euro 5,077.6 million in 2014. As a percentage of net sales, gross profit increased to 67.9% in 2015 from 66.4% in 2014 due
to the factors noted above.
Adjusted gross profit, excluding expenses of Euro 0.7 million, was Euro 6,001.8, or 66.6% as percentage of net sales.
(in millions of Euro) 2015
2014
Gross profit
6,001.2
5,077.6
- Adjustment for the reorganization of Oakley and other minor projects 0.7
-
Adjusted gross profit 6,001.8
5,077.6
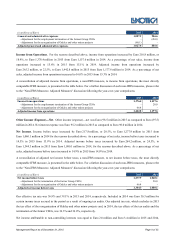
Operating Expenses. Total operating expenses increased by Euro 704.7 million, or 18.0%, to Euro 4,624.7 million in 2015
from Euro 3,920.0 million in 2014. As a percentage of net sales, operating expenses were 52.3% in 2015 compared to
51.2% in 2014.
Total adjusted operating expenses increased by Euro 659.0 million, or 16.9%, to Euro 4,559.0 million in 2015 from
Euro 3,900.0 million in 2014, excluding, for 2015, expenses of Euro 65.7 million related to the reorganization of Oakley
and other minor projects and, for 2014, non-recurring expenses of Euro 20.0 million related to the termination of the
employment of the former Group CEOs. As a percentage of net sales, adjusted operating expenses decreased to 50.6%
in 2015 from 50.7% in 2014. A reconciliation of adjusted operating expenses, a non-IFRS measure, to operating expenses,
the most directly comparable IFRS measure, is presented in the table below. For a further discussion of such non-IFRS