LensCrafters 2015 Annual Report Download - page 127
Download and view the complete annual report
Please find page 127 of the 2015 LensCrafters annual report below. You can navigate through the pages in the report by either clicking on the pages listed below, or by using the keyword search tool below to find specific information within the annual report.-
 1
1 -
 2
2 -
 3
3 -
 4
4 -
 5
5 -
 6
6 -
 7
7 -
 8
8 -
 9
9 -
 10
10 -
 11
11 -
 12
12 -
 13
13 -
 14
14 -
 15
15 -
 16
16 -
 17
17 -
 18
18 -
 19
19 -
 20
20 -
 21
21 -
 22
22 -
 23
23 -
 24
24 -
 25
25 -
 26
26 -
 27
27 -
 28
28 -
 29
29 -
 30
30 -
 31
31 -
 32
32 -
 33
33 -
 34
34 -
 35
35 -
 36
36 -
 37
37 -
 38
38 -
 39
39 -
 40
40 -
 41
41 -
 42
42 -
 43
43 -
 44
44 -
 45
45 -
 46
46 -
 47
47 -
 48
48 -
 49
49 -
 50
50 -
 51
51 -
 52
52 -
 53
53 -
 54
54 -
 55
55 -
 56
56 -
 57
57 -
 58
58 -
 59
59 -
 60
60 -
 61
61 -
 62
62 -
 63
63 -
 64
64 -
 65
65 -
 66
66 -
 67
67 -
 68
68 -
 69
69 -
 70
70 -
 71
71 -
 72
72 -
 73
73 -
 74
74 -
 75
75 -
 76
76 -
 77
77 -
 78
78 -
 79
79 -
 80
80 -
 81
81 -
 82
82 -
 83
83 -
 84
84 -
 85
85 -
 86
86 -
 87
87 -
 88
88 -
 89
89 -
 90
90 -
 91
91 -
 92
92 -
 93
93 -
 94
94 -
 95
95 -
 96
96 -
 97
97 -
 98
98 -
 99
99 -
 100
100 -
 101
101 -
 102
102 -
 103
103 -
 104
104 -
 105
105 -
 106
106 -
 107
107 -
 108
108 -
 109
109 -
 110
110 -
 111
111 -
 112
112 -
 113
113 -
 114
114 -
 115
115 -
 116
116 -
 117
117 -
 118
118 -
 119
119 -
 120
120 -
 121
121 -
 122
122 -
 123
123 -
 124
124 -
 125
125 -
 126
126 -
 127
127 -
 128
128 -
 129
129 -
 130
130 -
 131
131 -
 132
132 -
 133
133 -
 134
134 -
 135
135 -
 136
136 -
 137
137 -
 138
138 -
 139
139 -
 140
140 -
 141
141 -
 142
142 -
 143
143 -
 144
144 -
 145
145 -
 146
146 -
 147
147 -
 148
148 -
 149
149 -
 150
150 -
 151
151 -
 152
152 -
 153
153 -
 154
154 -
 155
155 -
 156
156 -
 157
157 -
 158
158 -
 159
159 -
 160
160 -
 161
161 -
 162
162 -
 163
163 -
 164
164 -
 165
165 -
 166
166 -
 167
167 -
 168
168 -
 169
169 -
 170
170 -
 171
171 -
 172
172 -
 173
173 -
 174
174 -
 175
175 -
 176
176 -
 177
177 -
 178
178 -
 179
179 -
 180
180 -
 181
181 -
 182
182 -
 183
183 -
 184
184 -
 185
185 -
 186
186 -
 187
187 -
 188
188 -
 189
189 -
 190
190 -
 191
191 -
 192
192 -
 193
193 -
 194
194 -
 195
195 -
 196
196 -
 197
197 -
 198
198 -
 199
199 -
 200
200 -
 201
201 -
 202
202 -
 203
203 -
 204
204 -
 205
205 -
 206
206 -
 207
207 -
 208
208 -
 209
209 -
 210
210 -
 211
211 -
 212
212 -
 213
213 -
 214
214 -
 215
215 -
 216
216 -
 217
217 -
 218
218 -
 219
219 -
 220
220 -
 221
221 -
 222
222 -
 223
223 -
 224
224 -
 225
225 -
 226
226 -
 227
227 -
 228
228 -
 229
229 -
 230
230 -
 231
231 -
 232
232 -
 233
233 -
 234
234 -
 235
235 -
 236
236 -
 237
237 -
 238
238 -
 239
239 -
 240
240 -
 241
241 -
 242
242 -
 243
243 -
 244
244 -
 245
245 -
 246
246 -
 247
247 -
 248
248 -
 249
249 -
 250
250 -
 251
251 -
 252
252 -
 253
253 -
 254
254 -
 255
255 -
 256
256 -
 257
257 -
 258
258 -
 259
259 -
 260
260 -
 261
261 -
 262
262 -
 263
263 -
 264
264 -
 265
265 -
 266
266 -
 267
267 -
 268
268 -
 269
269 -
 270
270
 |
 |
Notes to the consolidated financial statement as of December 31, 2015 Page 33 di 68
NON-CURRENT ASSETS
10. PROPERTY, PLANT AND EQUIPMENT
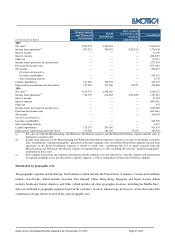
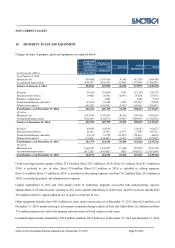
Changes in items of property, plant and equipment are reported below:
(in thousands of Euro)
Land and
buildings,
including
leasehold
improvements
Machinery
and
equipment
Aircraft
Other
equipment
Total
As of January 1, 2014
Historical cost 910,968
1,107,816
38,145
612,555
2,669,485
Accumulated depreciation (454,957)
(681,918)
(11,894)
(337,480)
(1,486,249)
Total as of January 1, 2014 456,011
425,898
26,252
275,075
1,183,236
Increases 59,160
101,646
7,851
112,120
280,778
Decreases/write-downs (3,908)
(4,508)
(2,893)
(4,164)
(15,473)
Business combinations —
4,698
—
1,026
5,724
Translation difference and other 45,674
61,162
3,807
(22,745)
87,898
Depreciation expense (60,625)
(101,540)
(1,763)
(60,619)
(224,547)
Total balance as of December 31, 2014 496,313
487,359
33,253
300,693
1,317,617
Of which:
Historical cost 1,032,956
1,303,833
46,300
700,746
3,083,835
Accumulated depreciation (536,643)
(816,474)
(13,047)
(400,053)
(1,766,218)
Total as of December 31, 2014 496,313
487,359
33,253
300,693
1,317,617
Increases 89,892
101,950
—
170,633
362,475
Decreases/write-downs (8,311)
(2,105)
(1,537)
(7,758)
(19,711)
Translation difference and other 38,714
51,795
(19,255)
(22,611)
48,643
Depreciation expense (73,834)
(124,405)
(1,965)
(73,295)
(273,499)
Total balance as of December 31, 2015 542,774
514,594
10,496
367,661
1,435,524
Of which:
Historical cost 1,160,057
1,456,077
11,362
825,695
3,453,190
Accumulated depreciation (617,283)
(941,482)
(865)
(458,033)
(2,017,664)
Total balance as of December 31, 2015 542,774
514,594
10,496
367,661
1,435,524
Of the total depreciation expense of Euro 273.5 million (Euro 224.5 million in 2014), Euro 94.1 million (Euro 81.3 million in
2014) is included in cost of sales, Euro 133.6 million (Euro 111.3 million in 2014) is included in selling expenses,
Euro 11.6 million (Euro 7.9 million in 2014) is included in advertising expenses and Euro 34.2 million (Euro 24.0 million in
2014) is included in general and administrative expenses.
Capital expenditures in 2015 and 2014 mainly relate to technology upgrades associated with manufacturing capacity,
enhancements to IT infrastructure, opening of new stores and the remodeling of older stores. In 2015 increases include Euro
26.0 million related to capital additions not yet paid as of the end of year.
Other equipment includes Euro 108.5 million for assets under construction as of December 31, 2015 (Euro 62.6 million as of
December 31, 2014) mainly relating to investments in manufacturing facilities in Italy and China (Euro 16.2 million and Euro
37.6 million respectively) and to the opening and renovation of North America retail stores.
Leasehold improvements totaled Euro 202.9 million and Euro 169.2 million as of December 31, 2015 and December 31, 2014,
